BEL Share Price 2026: Growth, Valuation & Order Book


    By Dalal Street Investment Journal (DSIJ)

    Summary :


    Bharat Electronics Ltd reported ₹6,062 crore PAT in FY26 with 31.2% EBITDA margin and maintained a debt-free balance sheet. Its ₹74,000 crore order book, defence electronics portfolio and execution capability remain key factors influencing future growth.

    BEL Share Price: Defence Growth, Order Book & Valuation

    Factors relevant to a long-term assessment of BEL include its defence order pipeline, the use of electronics in modern warfare, and its ability to execute projects while maintaining profitability.

    BEL operates across radars, communication systems, electronic warfare and naval solutions. With an order book of around ₹74,000 crore at the start of FY27, the company has visibility into potential future revenue. However, the stock’s valuation reflects only part of the expected growth in the defence sector.

    Going ahead, execution remains a factor to monitor. Timely delivery of projects, working capital management and maintaining margins will influence the company’s ability to meet market expectations.

    BEL’s strategic role, balance sheet and return ratios are among the factors reflected in its valuation. Future stock performance will depend on earnings growth and changes in valuation. When assessing the stock, investors should consider both the company’s growth prospects and its valuation.

    BEL: Business Model, Revenue Mix and Market Position

    Bharat Electronics Limited (BEL) is a defence electronics company and a Navratna PSU under the Ministry of Defence. Established in 1954, the company supplies systems to the armed forces across areas such as radars, communication networks, electronic warfare, naval systems and missile electronics.

    Unlike defence companies focused on manufacturing platforms, BEL operates mainly in defence electronics and system integration. This segment provides exposure to the use of technology in modern warfare, including surveillance, communication and electronic countermeasures.

    Business segment

    Contribution

    Defence business

    90%

    Non-defence business

    10%

    Defence remains BEL’s primary revenue driver, contributing around 90% of FY26 revenue. Its non-defence operations include areas such as homeland security, smart cities, medical electronics and railway systems.

    BEL’s business includes its association with the military, indigenous design capabilities and participation in defence projects. In FY26, the firm received orders worth around ₹30,000 crore across sectors, including radars, avionics, electronic warfare and naval systems.

    India’s emphasis on defence indigenisation and reduced dependency on imports may affect the demand environment in the sector. Relevant factors include order execution, technological developments and competition.

    BEL Financial Performance: Revenue, PAT And Margins (FY24–FY26)

    BEL reported financial results over the past three years, supported by defence spending, execution of existing programmes and its order backlog. Its revenue is distributed across various defence electronics sectors.

    Financials (₹ crore)

    FY24

    FY25

    FY26

    Revenue from operations

    20,268

    23,769

    27,610

    Revenue growth

    —

    17%

    16%

    EBITDA

    5,717

    7,576

    8,615

    EBITDA margin

    28.21%

    31.87%

    31.20%

    Profit Before Tax (PBT)

    5,266

    7,099

    8,053

    Profit After Tax (PAT)

    3,985

    5,323

    6,062

    (Source: BSE, Company Annual Report)

    Revenue from operations of BEL grew from ₹20,268 crore in FY24 to ₹27,610 crore in FY26, supported by defence demand and execution. Revenue growth was 16.16% in FY26 following growth in FY25.

    PAT increased from ₹3,985 crore in FY24 to ₹6,062 crore in FY26. The EBITDA margin was above 30% during FY26, based on the reported financial results.

    Moving forward, the company’s growth will depend on execution of its order backlog and profitability.

    Key ratios: P/E, P/B, ROE, ROCE and Debt-to-Equity vs Sector Average

    BEL has historically traded at a premium valuation, with return ratios, its debt-free balance sheet and its role in India’s defence ecosystem among the factors considered by the market. Future returns will depend on earnings growth and changes in valuation.

    Key ratio (FY26/TTM)

    BEL

    View

    Observation

    48x

    Premium valuation

    Valuation

    12x

    Reflects high return ratios

    ROE of 27%

    27%

    Strong capital efficiency

    ROCE of 36%

    36%

    Healthy operating efficiency

    Debt-to-equity of 0.00x

    0.00x

    Strong balance sheet

    (Source: DSIJ, BSE, NSE)

    The company’s ROE was 27%, and ROCE was 36%. The company also had a debt-to-equity ratio of 0.00x, based on the reported figures.

    Valuation remains an important factor, with the defence industry trading at a P/E of around 85.7 times. BEL’s valuation reflects factors including profitability, its role in the defence sector, order visibility and India’s import substitution efforts.

    Going ahead, the valuation will depend in part on whether earnings growth supports the prevailing market multiple.

    BEL Technical Analysis: Support, Resistance and Moving Averages

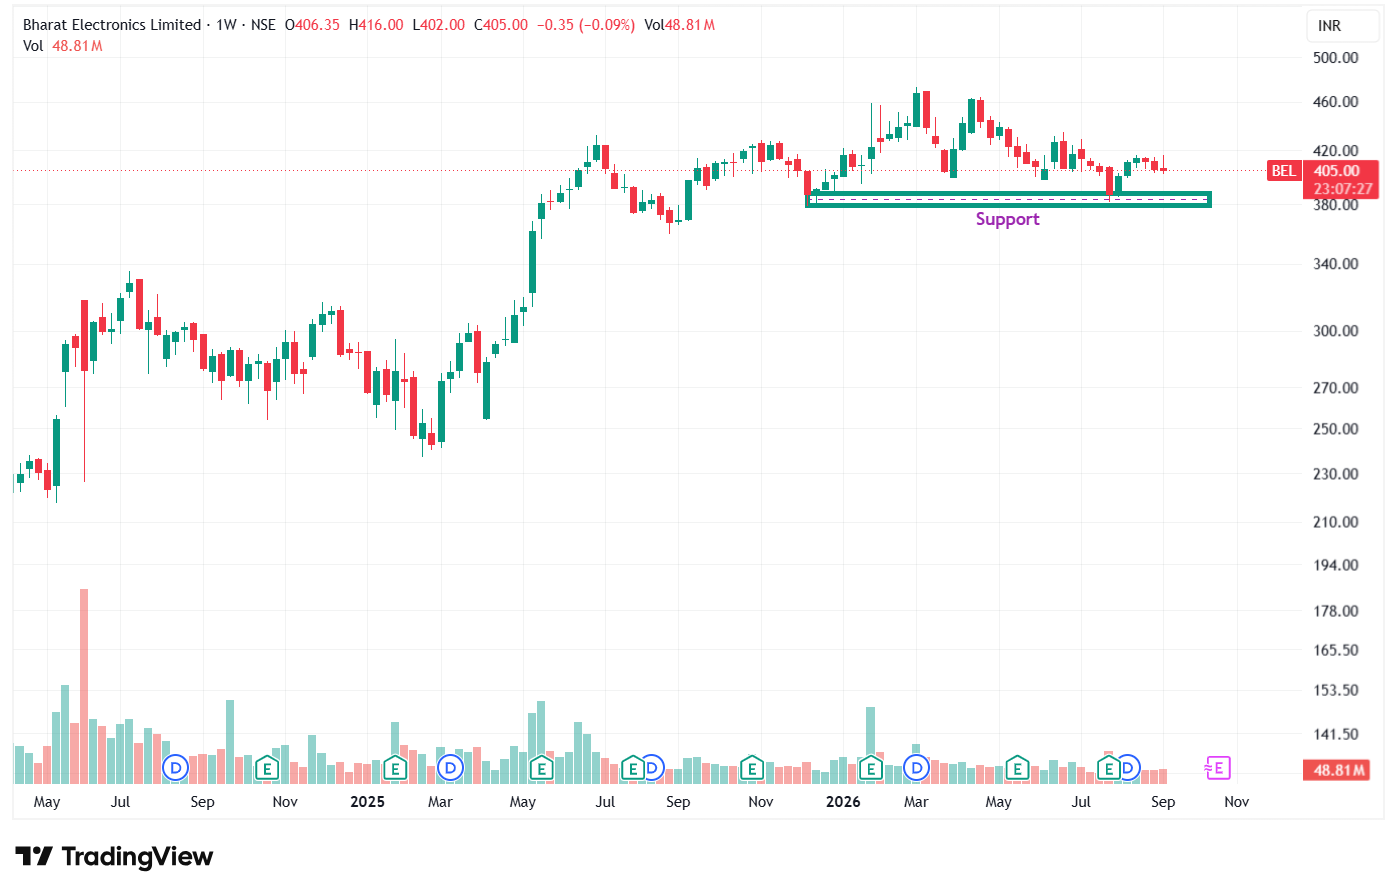
    In CY26 so far, BEL’s share price has gained 1.22% as of September 10, 2026. From a technical perspective, the weekly chart shows a support zone at ₹378-380. This support is based on a horizontal trendline. Resistance is placed in the ₹431-435 region. A sustained move above this zone would indicate a change in price momentum.

    BEL Share Price: Defence Growth, Order Book & Valuation

    The stock is currently trading below its short-term, medium-term and long-term moving averages on the daily time frame. On the weekly time frame, the stock is trading below its 20 and 50-week moving averages, while it continues to hold above the 100 and 200-week moving averages.

    Shareholding Pattern: Promoter, FII and DII Trend Over 4 Quarters

    BEL’s ownership structure reflects continued Government of India control of the company. Institutional investors also hold a portion of the company’s shares.

    Shareholding Pattern

    Sep 2025

    Dec 2025

    Mar 2026

    Jun 2026

    Promoters

    51.14%

    51.14%

    51.14%

    51.14%

    FIIs

    18.14%

    18.51%

    19.51%

    18.02%

    DIIs

    20.88%

    20.47%

    20.00%

    21.02%

    Public & Others

    9.84%

    9.87%

    9.37%

    9.82%

    (Source: BSE, NSE, DSIJ)

    Promoter shareholding was 51.14% across the four reported quarters, indicating the government’s control in BEL. FII shareholding decreased in Jun 2026 after increasing in the previous quarters, while DII shareholding increased to 21.02%.

    BEL’s ownership structure remained broadly stable across the reported quarters. The domestic institutional stake increased to 21.02% in Jun 2026, while FII shareholding was 18.02%.

    BEL’s EPS grew at a CAGR of around 25% during FY22-FY26. The change in earnings was supported by defence expenditure, execution and the company’s order book.

    Peer Comparison Within the Aerospace & Defence Sector

    BEL operates in the defence electronics segment, focusing on radars, communication systems and electronic warfare. HAL manufactures aircraft and aerospace platforms, while BDL focuses on missiles. The comparison highlights differences in the businesses and the role of electronics in defence systems.

    Company

    Core business

    FY26 revenue

    Order book

    BEL

    Defence electronics, radars, communication systems

    ₹27,610 crore

    ₹74,000 crore

    HAL

    Aircraft, helicopters and aerospace platforms

    ₹33,000 crore

    ₹2.5 lakh crore

    BDL

    Missiles and missile systems

    ₹2,866 crore

    ₹26,176 crore

    Data Patterns

    Defence electronics and aerospace systems

    ₹925 crore

    ₹926 crore

    (Source: DSIJ, Companies Annual Reports)

    HAL has a large order backlog for its aircraft programmes, while BEL operates across several defence electronics sectors. Data Patterns has a smaller revenue base and operates in defence electronics and aerospace systems. Differences in size, business mix and order books affect how these companies compare.

    BEL’s long-term growth will depend on converting its order pipeline into revenue while maintaining profitability during India’s defence indigenisation cycle.

    Key Risks: What Could Break the Investment Thesis

    BEL operates in the defence sector, and factors that may affect its performance include execution, valuation and competition. Its order book was worth ₹74,000 crore at the start of FY27.

    Risk factor

    Impact on BEL

    Premium valuation

    Any slowdown in earnings growth could lead to valuation correction.

    Order execution delays

    Delays in converting the order book into revenue may impact growth.

    Government dependency

    A large portion of the business depends on defence procurement decisions.

    Margin pressure

    Changes in product mix or project execution costs can affect profitability.

    Rising competition

    Increased participation from private defence companies may impact future opportunities.

    (Source: DSIJ, BEL Annual Report)

    Valuation is a factor, as BEL trades at a premium relative to some measures of the sector. A slowdown in earnings growth could put pressure on the valuation.

    Factors to monitor include order conversion, execution efficiency and margin sustainability.

    BEL Order Book and Defence Order-Inflow Guidance

    BEL’s order book is supported by its presence across defence electronics segments such as radars, communication systems, electronic warfare and naval systems.

    Order book parameters

    Details

    Order book position

    ₹74,000 crore

    FY26 order inflows

    ₹30,000 crore

    FY27 order inflow guidance

    ₹55,000 crore

    Export order book

    $495 million

    (Source: DSIJ, BEL Annual Report)

    The company secured orders worth around ₹30,000 crore in FY26 and entered FY27 with an order backlog of ₹74,000 crore. BEL has guided for order inflows of over ₹55,000 crore in FY27, with opportunities including programmes such as QRSAM, LRSAM, Akash missile systems, electronic warfare solutions and radar systems.

    The company’s order pipeline provides revenue visibility, while defence contracts can take time due to testing and approval requirements.

    Moving forward, BEL’s growth will depend on converting its pipeline orders into revenue and securing additional defence contracts.

    BEL's Role in Defence Indigenisation and Make in India

    BEL is part of India’s push for self-reliance in defence. The company works across radars, electronic warfare systems, communication networks, weapon systems, electro-optics and network-centric solutions, which can contribute to reducing dependence on imported defence electronics.

    BEL focuses on indigenous technology development. Products designed and manufactured within India contribute around 80% of the company’s annual revenue, while R&D spending has remained in the range of 6.25–7.5% of sales over the past five years.

    The company has over 2,600 R&D engineers working on technology development and localisation. BEL also collaborates with DRDO, research institutions, MSMEs, start-ups and private companies on defence systems and the domestic supply chain.

    BEL’s role in defence indigenisation provides exposure to India’s focus on locally developed defence equipment. Converting these opportunities into orders and profitable growth will depend on execution.

    BEL Bonus and Dividend History

    BEL has paid bonuses and dividends to shareholders. Its cash flows, debt position and government-backed business structure are among the factors associated with its shareholder payout policy.

    BEL Bonus History

    Ex-bonus date

    Bonus ratio

    September 2015

    2:1

    September 2017

    1:10

    September 2022

    2:1

    (Source: BSE, NSE)

    BEL has announced three bonus issues since 2015, the latest being a 2:1 ratio in September 2022. This means shareholders received two additional shares for every one share held on the record date.

    Recent Dividend History

    Financial year

    Dividend per share

    FY26

    ₹2.50

    FY25

    ₹2.40

    FY24

    ₹2.20

    (Source: BSE, NSE)

    BEL has paid dividends in the reported financial years. The share price and dividend per share influence the dividend yield.

    Changes in the share price and dividends have driven shareholder returns. The contribution of each component can vary over time.

    Frequently Asked Questions

    About the Author

    SEBI Registered Research Analyst (INH000006396).


    Founded in 1986, Dalal Street Investment Journal (DSIJ) brings decades of experience in India’s equity markets. DSIJ's research combines fundamental analysis with price action, guided by disciplined risk management and capital preservation. They follow a structured, data-driven approach designed to help investors and traders make informed decisions beyond short-term market noise. 

    Share Market Latest News

    Published Date : 29 Sep 2026

    Disclaimer :

    Investments in securities market are subject to market risk, read all related documents carefully before investing. This content is for educational purposes only. Securities quoted are exemplary and not recommendatory.
    The information on this website is provided on "AS IS" basis. Bajaj Broking (BFSL) does not warrant the accuracy of the information given herein, either expressly or impliedly, for any particular purpose and expressly disclaims any warranties of merchantability or suitability for any particular purpose. While BFSL strives to ensure accuracy, it does not guarantee the completeness, reliability, or timeliness of the information. Users are advised to independently verify details and stay updated with any changes.

    The information provided on this website is for general informational purposes only and is subject to change without prior notice. BFSL shall not be responsible for any consequences arising from reliance on the information provided herein and shall not be held responsible for all or any actions that may subsequently result in any loss, damage and/or liability. Interest rates, fees, and charges etc., are revised from time to time, for the latest details please refer to our Pricing page.

    Neither the information, nor any opinion contained in this website constitutes a solicitation or offer by BFSL or its affiliates to buy or sell any securities, futures, options or other financial instruments or provide any investment advice or service.

    BFSL is acting as distributor for non-broking products/ services such as IPO, Mutual Fund, Insurance, PMS, and NPS. These are not Exchange Traded Products. For more details on risk factors, terms and conditions please read the sales brochure carefully before investing.


    Content Partner - Dalal Street Investment Journal Wealth Advisory Private Limited


    This article is for educational purposes only and should not be considered investment advice. Market investments are subject to risks. DSIJ Wealth Advisory Private Limited is a SEBI-registered Research Analyst (Reg. No: INH000006396) and Investment Adviser (Reg. No: INA000001142). Please consult your financial adviser before investing. 

    For more disclaimer, check here : https://www.bajajbroking.in/disclaimer

    Our Secure Trading Platforms

    Level up your stock market experience: Scan the QR to download the Bajaj Broking App for effortless investing and trading

    Scan the QR code to download Bajaj Broking App

    1 M+ Users

    4.8 App Rating

    4 Languages

    ₹8,422 Cr+ MTF Book