What Is the IREDA Share Price Today?
The latest verified completed NSE session ended at ₹108.26 on 15 October 2026.
By Dalal Street Investment Journal (DSIJ)
IREDA recorded ₹8,338.89 crore in FY26 income, ₹1,873 crore in profit and a ₹93,069 crore loan book. This article covers asset quality and renewable finance exposure.
Indian Renewable Energy Development Agency (IREDA), a Navratna government renewable energy financier, closed at ₹108.26 on the NSE on 15 October 2026.
| Key Metrics | IREDA |
|---|---|
| Share price (NSE close, 15 Oct 2026) | ₹108.26 |
| Market capitalisation | ₹30,413 crore |
| 52-week high | ₹158.70 |
| 52-week low | ₹103.41 |
| P/E ratio | 15.5x |
| P/B ratio | 2.2x |
| FY26 total income | ₹8,338.89 crore |
| FY26 PAT | ₹1,873 crore |
| Dividend yield | 1.26% |
(Sources: NSE close on StockAnalysis; Business Standard; Screener.)
IREDA traded near the bottom of its 52-week range (₹103.41 to ₹158.70). A lower price alone does not indicate undervaluation; instead, valuation is linked to the quality of lending, future credit costs, funding spreads, and the price-to-book multiple.
IREDA, established in 1987 and controlled by the Ministry of New and Renewable Energy, lends to renewable power and energy efficiency projects. As an NBFC, its primary income comes from interest on loans rather than product sales. Therefore, the portfolio mix below is a loan book split, not a segment revenue breakdown. IREDA has Navratna status and RBI recognition as an Infrastructure Finance Company (NBFC-IFC).
| FY26 Loan Book Segment | Share of Outstanding Loans |
|---|---|
| Solar | 26.28% |
| State utility loans | 22.76% |
| Wind | 14.41% |
| Manufacturing | 9.63% |
| Other financing categories | 26.92% |
(Source: IREDA website, sector-wise outstanding loan book as at 31 March 2026.)
Solar, state utility loans and wind together represented about 63% of the ₹93,069 crore in loans for FY26. This concentration affects credit performance, which depends on project execution, power offtake, and utility payment discipline.
| FY26 Business Indicator | ₹ Crore |
|---|---|
| Loan sanctions | 51,883 |
| Loan disbursements | 34,946 |
(Source: IREDA FY26 audited results release, 29 May 2026.)
IREDA finances a growing market: MNRE reported approximately 299.25 GW of installed renewable capacity, including large hydro, as of 30 September 2026. IBEF also highlights India’s 500 GW non-fossil power ambition by 2030. Sector expansion is linked to addressable demand; sanctioned projects are not automatically disbursed or profitable loans.
IREDA’s standalone total income increased from about ₹4,965 crore in FY24 to ₹8,338.89 crore in FY26 as its loan portfolio expanded. Profit also grew, while its financing margin declined from 35% to 29%, and gross NPA rose during FY26 as the loan book expanded.
| Financials | FY24 | FY25 | FY26 |
|---|---|---|---|
| Total income (₹ crore) | 4,965 | 6,754 | 8,339 |
| Income growth | 43% | 36% | 23% |
| Financing profit (₹ crore) | 1,716 | 2,142 | 2,382 |
| Financing margin | 35% | 32% | 29% |
| PAT (₹ crore) | 1,252 | 1,699 | 1,873 |
(Sources: IREDA FY24 to FY26 audited accounts; FY26 results release; Screener standalone P&L. Rounded to ₹ crore.)
For a lending NBFC, EBITDA margin is not an especially meaningful measure because interest expense is a core operating cost. This table therefore reports Screener’s financing profit and financing margin in place of manufacturing-style EBITDA. These metrics are not the same as net interest margin (NIM).
Indian Renewable Energy Development Agency Limited (IREDA) reported its Q2 FY27 financial results, demonstrating steady operational growth. Total income for the quarter reached ₹2,344.75 crore, up from ₹2,057.45 crore in Q2 FY26, primarily driven by higher interest income of ₹2,316.97 crore. Profit Before Tax (PBT) stood at ₹706.57 crore compared to ₹696.07 crore YoY, while total expenses were managed at ₹1,638.18 crore. The company continues to show robust performance in financing renewable energy projects.
At the 15 October reference price, IREDA’s trailing P/E was about 15.5x and P/B about 2.2x. FY26 borrowings of approximately ₹77,846 crore against ₹13,781 crore net worth imply around 5.65x debt to equity. Leverage is part of an NBFC’s business model; funding and liquidity risks are related factors.
| Key Ratio (FY26/TTM) | IREDA |
|---|---|
| P/E | 15.5x |
| P/B | 2.2x |
| ROE | 15.6% |
| ROCE | 8.69% |
| Debt to equity (FY26) | 5.65x |
| Dividend yield | 1.26% |
(Sources: Screener, IREDA FY26 audited balance sheet and 15 October NSE close. P/B and debt/equity derived; valuation ratios change daily.)
There is no single Finance sector average that represents renewable-focused project NBFCs. PFC and REC were around 5.5x and 5.1x P/E, respectively, and near 1x book value in mid-October. IREDA’s multiples are higher than those of PFC and REC; the difference is linked to a different growth and sector mix.
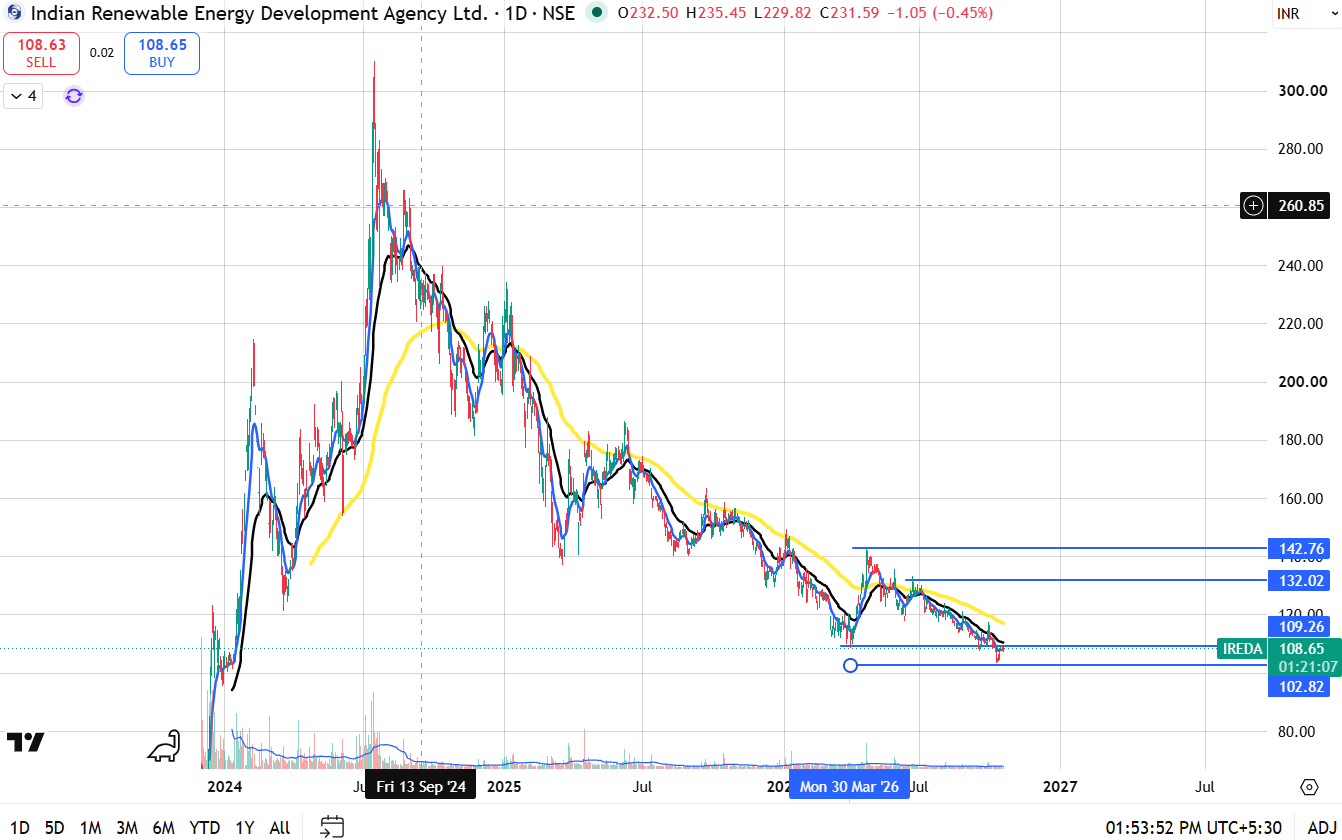
On a technical basis, the share price of IREDA has shown a pattern of lower highs and lower lows on a weekly time frame. A near-term support level has been noted at ₹102.
A resistance level has been noted at ₹132. A move beyond this level would represent a change from the current pattern of lower highs and lower lows.
As of October 16, IREDA is trading below its short term, medium term and long term moving averages on the daily chart. On the weekly chart, the stock is trading below its 10-week, 30-week and 100-week moving averages.
Government promoter ownership stayed at 71.76% across the four disclosed quarters through June 2026. FII ownership rose while DII ownership eased modestly. The September 2026 quarter distribution was not yet included in the verified source table, so the last four available quarters are shown.
| Holder Category | Sep 2025 | Dec 2025 | Mar 2026 | Jun 2026 |
|---|---|---|---|---|
| Promoters | 71.76% | 71.76% | 71.76% | 71.76% |
| FIIs | 1.92% | 2.07% | 2.14% | 2.48% |
| DIIs (including MFs) | 2.57% | 2.51% | 2.44% | 2.39% |
| Public & others | 23.75% | 23.67% | 23.65% | 23.35% |
(Source: Screener and ET Money shareholding records; DII includes mutual funds. Percentages rounded.)
Foreign ownership rose from 1.92% in September 2025 to 2.48% in June 2026, whereas total DII ownership declined from 2.57% to 2.39%. Shifts are modest and do not indicate future institutional demand. Government ownership may also change if IREDA raises additional equity.
Power Finance Corporation (PFC) and REC are listed infrastructure lender reference points; all three finance long-life energy assets. However, PFC and REC have broader power sector exposures, different funding franchises, credit mixes and dividend histories.
| Company | Business Focus | P/E | P/B |
|---|---|---|---|
| IREDA | Renewable project finance | 15.5x | 2.20x |
| PFC | Power/infrastructure lending | 5.54x | 1.03x |
| REC | Power/infra lending | 5.10x | 0.97x |
(Sources: Screener individual standalone company pages; indicative mid October 2026 multiples.)
IREDA’s P/E (15.5x) and P/B (2.2x) are higher than those of PFC (5.54x and 1.03x) and REC (5.10x and 0.97x), while its ROE (15.6%) is lower than the roughly 20% of both. Its specialised renewable financing exposure is linked to investor interest, and higher multiples can be associated with share price sensitivity to changes in expected growth or credit losses.
IREDA finances capital-intensive projects with long construction and repayment cycles. Land, grid connection, tariffs, offtaker payments, or concentrated corporate exposure can delay repayment. Gross NPA increased from 2.45% in March 2025 to 3.49% in March 2026, then 3.76% by June 2026.
Borrowings fund the majority of the asset book. If wholesale funding rates rise more quickly than loan yields, lending spreads can compress. Expanding equity capital supports future loans and regulatory capital adequacy but can dilute per share growth if deployed returns disappoint.
A price-to-book multiple above that of peers indicates that earnings meet expectations. Changes to RBI NBFC norms, government renewable policy, public sector utility payment health, or large project commissioning or provisioning rules could alter earnings and investor sentiment.
IREDA is a renewable energy financier controlled by the Government of India, with a loan book of ₹93,069 crore at March 2026 and ₹94,852 crore at June 2026. Its P/E is 15.5x and P/B 2.2x, compared with 5.54x and 1.03x for PFC and 5.10x and 0.97x for REC. Gross NPA was 3.76% in June 2026.
The Q2 FY27 earnings release, gross and net NPAs, recoveries, credit costs, lending spreads, and P/B relative to sustainable ROE are all factors that will influence future results.
IREDA’s loan book increased from ₹59,698 crore in FY24 to ₹76,282 crore in FY25 and ₹93,069 crore in FY26, equivalent to around 22% growth in FY26. Sanctions totalled ₹51,883 crore and disbursements ₹34,946 crore in FY26. As of June 2026, outstanding loans were around ₹94,852 crore, reflecting further portfolio expansion.
Credit quality indicators moved in different directions. Gross NPA rose to 3.76% in June 2026 from 3.49% at the end of March, while net NPA improved to approximately 1.23% from 1.29%, which may reflect provisioning and recoveries. Fresh slippages and the concentration of stressed borrowers are data points alongside loan book growth.
RBI granted IREDA Infrastructure Finance Company status in March 2023. Its focus spans solar, wind, hydro, energy storage, green hydrogen, electric mobility and other low-carbon infrastructure. The designation aligns the company with infrastructure lending regulation and helps frame its funding and project tenor activities; it does not mean loans are sovereign guaranteed.
MNRE figures showed solar at about 171.05 GW and wind at 59.20 GW of installed capacity as of September 2026. IBEF describes a multi-year investment pipeline. Spreads, delinquencies and concentration are the factors linked to whether IREDA can underwrite those opportunities.
At roughly ₹108 and a book value of around ₹49.1 per share, IREDA traded at about 2.2 times book value, compared with approximately 1.03x for PFC and 0.97x for REC. Its renewable-only positioning and growth opportunity may be linked to the higher multiple; its reported ROE of 15.6% was below the roughly 20% levels of both peers.
For financial institutions, analysts read P/B together with through-cycle ROE, required equity returns, credit costs, funding stability and growth. A multiple above book is linked to the level of ROE that is sustained; higher defaults or frequent dilution are factors that could affect the multiple.
Source: Dalal Street Investment Journal (DSIJ), Opstra, BSE
The latest verified completed NSE session ended at ₹108.26 on 15 October 2026.
Standalone FY26 profit after tax was around ₹1,873 crore, while the year end outstanding loan book reached about ₹93,069 crore.
No. It is a regulatory classification; project delays, bad loans, interest rate movements and borrower concentration are risk factors.
The Q2 FY27 results scheduled for 19 October 2026, gross and net NPAs, fresh slippages, financing margins, provisions, funding costs and any capital raising announcements.
SEBI Registered Research Analyst (INH000006396).
Founded in 1986, Dalal Street Investment Journal (DSIJ) brings decades of experience in India’s equity markets. DSIJ's research combines fundamental analysis with price action, guided by disciplined risk management and capital preservation. They follow a structured, data-driven approach designed to help investors and traders make informed decisions beyond short-term market noise.

Share Market Latest News
Disclaimer :
Investments in securities market are subject to market risk, read all related documents carefully before investing. This content is for educational purposes only. Securities quoted are exemplary and not recommendatory.
The information on this website is provided on "AS IS" basis. Bajaj Broking (BFSL) does not warrant the accuracy of the information given herein, either expressly or impliedly, for any particular purpose and expressly disclaims any warranties of merchantability or suitability for any particular purpose. While BFSL strives to ensure accuracy, it does not guarantee the completeness, reliability, or timeliness of the information. Users are advised to independently verify details and stay updated with any changes.
The information provided on this website is for general informational purposes only and is subject to change without prior notice. BFSL shall not be responsible for any consequences arising from reliance on the information provided herein and shall not be held responsible for all or any actions that may subsequently result in any loss, damage and/or liability. Interest rates, fees, and charges etc., are revised from time to time, for the latest details please refer to our Pricing page.
Neither the information, nor any opinion contained in this website constitutes a solicitation or offer by BFSL or its affiliates to buy or sell any securities, futures, options or other financial instruments or provide any investment advice or service.
BFSL is acting as distributor for non-broking products/ services such as IPO, Mutual Fund, Insurance, PMS, and NPS. These are not Exchange Traded Products. For more details on risk factors, terms and conditions please read the sales brochure carefully before investing.
Content Partner - Dalal Street Investment Journal Wealth Advisory Private Limited
This article is for educational purposes only and should not be considered investment advice. Market investments are subject to risks. DSIJ Wealth Advisory Private Limited is a SEBI-registered Research Analyst (Reg. No: INH000006396) and Investment Adviser (Reg. No: INA000001142). Please consult your financial adviser before investing.
For more disclaimer, check here : https://www.bajajbroking.in/disclaimer
Level up your stock market experience: Scan the QR to download the Bajaj Broking App for effortless investing and trading


Access Research Backed Stock Recommendations
|
Open Your Free Demat Account
Access Research Backed Stock Recommendations
|


"Investments in securities market are subject to market risk, read all the scheme related documents carefully before investing."
"Prevent Unauthorized transactions in your Trading/Demat Account. Update your mobile numbers/email IDs with your stock brokers/Depository Participant. Receive alerts/information of your transaction/all debit and other important transactions in your Trading/ Demat Account directly from Exchange/CDSL/NSDL at the end of the day. Issued in the interest of investors."
" We collect, retain, and use your contact information for legitimate business purposes only, to contact you and to provide you information & latest updates regarding our products & services."
"KYC is one time exercise while dealing in securities markets - once KYC is done through a SEBI registered intermediary (broker, DP, Mutual Fund etc.), you need not undergo the same process again when you approach another intermediary."
"We understand that certain investment advisors may be approaching members of the public including our clients, representing that they are our partners, or representing that their investment advice is based on our research. Please note that we have not engaged any third parties to render any investment advisory services on our behalf nor are we providing any stock recommendations/tips/research report/advisory. Persons making investments on the basis of such advice may lose all or a part of their investments along with the fee paid to such unscrupulous persons. Please be cautious about any phone call that you may receive from persons representing to be such investment advisors, or a part of research firm offering advice on securities. Do not make payments through e-mail links, WhatsApp or SMS. Please do not share your personal or financial information with any person without proper verification. Always trade through a registered broker."
Bajaj Financial Securities Limited is a subsidiary of Bajaj Finance Limited and is a corporate trading and clearing member of BSE Ltd. and National Stock Exchange of India Ltd. (NSEIL), and also a Depository participant with National Securities Depository Ltd (“NSDL”) and Central Depository Services Ltd. (“CDSL”).
Bajaj Financial Securities Limited is engaged in the business of Stock Broking and as a Depository Participant.Bajaj Financial Securities Limited does not provide any advisory services to its clients. Bajaj Financial Securities Limited may share updates from time to time (through various electronic communication modes) which are sourced from public domain and the same are NOT to be construed as any advice or recommendation from Bajaj Financial Securities Limited. Client is requested to independently evaluate and/or consult their professional advisors before arriving at any conclusion to make any investment. The decision to invest shall be the sole responsibility of the Client and shall not hold Bajaj Financial Securities Limited, its employees and associates responsible for any losses, damages of any type whatsoever.
BSE Ltd. is not in any manner answerable, responsible or liable to any person or persons for any acts of omission or commission, errors, mistakes and/or violation, actual or perceived, by us or our partners, agents, associates etc., of any of the Rules, Regulations, Bye-laws of the Stock Exchange, Mumbai, SEBI Act or any other laws in force from time to time.
BSE Ltd. is not answerable, responsible or liable for any information on this Website or for any services rendered by our employees, our servants, and us.
Personal Loan, Fixed Deposit, EMI Card are provided by Bajaj Finance Limited. Bajaj Financial Securities Limited is only a distributor. These are not exchange traded products and all disputes with respect to the distribution activity, would not have access to exchange investor redressal forum or Arbitration mechanism.
No need to issue cheques by investors while subscribing to IPO. Just write the bank account number and sign in the application form to authorise your bank to make payment in case of allotment. No worries for refund as the money remains in investor's account.
Client Registration Documents (Rights & Obligations, Risk Disclosure Document, Do's & Don'ts) in Vernacular Language: BSE | NSE
If the client wishes to revoke /cancel the EDIS mandate placed by them, they can write on email us or call on the toll free number.
Advisory for Investors : NSE | BSE
We also do pro-account trading in Equity & Derivatives Segment.
Filling complaints on SCORES/SMARTODR - Easy & Quick
A. Register on SCORES/SMARTODR portal B. Mandatory details for filling complaints on SCORES/SMARTODR (i) Name, PAN, Address, Mobile Number, E-mail ID C. Benefits: (i) Effective Communication (ii) Speedy redressal of the grievances.
SEBI Registration No.: INZ000218931 | BSE Cash/CDS/F&O (Member ID: 6706) | NSE Cash/F&O/CDS (Member ID: 90177) | MCX Member ID: 57680 | DP registration No : IN-DP-418-2019 | CDSL DP No.: 12088600 | NSDL DP No. IN304300 | AMFI Registration No.: ARN – 163403 Research Analyst SEBI Registration No. INH000010043
Compliance officer:
Mr. Harinatha Reddy Muthumula
TEL: 020-48574486
Email for any investor grievances or write to us for DP related matters.
DISCLAIMER
STANDARD DISCLAIMER
Investments in the securities market are subject to market risk, read all related documents carefully before investing.
Reg Office: Bajaj Auto Limited Complex, Mumbai –Pune Road Akurdi Pune 411035. Corporate Office: Bajaj Financial Securities Limited, 1st Floor, Mantri IT Park, Tower B, Unit No 9 & 10, Viman Nagar, Pune, Maharashtra 411014. SEBI Registration No.: INZ000218931 | BSE Cash/F&O/CDS (Member ID:6706) | NSE Cash/F&O/CDS (Member ID: 90177) | MCX Member ID: 57680 | DP registration No: IN-DP-418-2019 | CDSL DP No.: 12088600 | NSDL DP No. IN304300 | AMFI Registration No.: ARN –163403.
Website: Bajaj Broking
RESEARCH DISCLAIMER
Broking services offered by Bajaj Financial Securities Limited | Registered Office: Bajaj Auto Limited Complex , Mumbai –Pune Road Akurdi Pune 411035 | Corporate Office: Bajaj Financial Securities Limited, 1st Floor, Mantri IT Park, Tower B, Unit No 9 & 10, Viman Nagar, Pune, Maharashtra 411014 | CIN: U67120PN2010PLC136026 | Research Analyst SEB I Registration No: INH000010043.
Details of Compliance Officer:
Mr. Harinatha Reddy Muthumula (For Broking/DP/Research)
Email | Contact No.: 020-4857 4486
Investment in the securities involves risks, investor should consult his own advisors/consultant to determine the merits and risks of investment.
DISCLOSURES
Disclosures under the provisions of SEBI (Research Analysts) Regulations 2014 (Regulations)
Bajaj Financial Securities Limited ("Bajaj Broking" or "Research Entity") is regulated by the Securities and Exchange Board of India ("SEBI") and is licensed to carry on the business of broking, depository services and related activities. There were no instances of non-compliance by Bajaj Financial Securities Limited on any matter related to the capital markets, resulting in significant and material disciplinary action during the last three years. This research report has been prepared and distributed byBajaj Financial Securities Limited in the capacity of a Research Analyst as per Regulation 22(1) of SEBI (Research Analysts) Regulations 2014 having SEBI Registration No. INH000010043.
DISCLAIMER
This e-mail/ short message service (SMS) may contain confidential, proprietary or legally privileged information. It should not be used by anyone who is not the original intended recipient. If you have erroneously received this message, please delete it immediately and notify the sender. The recipient acknowledges thatBajaj Financial Securities Limited or its holding and/or associated companies, as the case may be, are unable to exercise control or ensure or guarantee the integrity of/over the contents of the information contained in e-mail /SMS transmissions and further acknowledges that any views expressed in this message are those of the individual sender and no binding nature of the message shall be implied or assumed unless the sender does so expressly with due authority of Bajaj Financial Securities Limited. This message is not intended as an offer or publication or solicitation for distribution for subscription of or purchase or sale of any securities or financial instrument(s) to anyone in whose jurisdiction such subscription etc. requires prior local regulatory clearance or is contrary to the local laws of the land in any manner or as an official confirmation of any transaction. Before opening any attachments, please check them for viruses and defects.
This service / information is strictly confidential and is being furnished to you solely for your information. This information should not be reproduced or redistributed or passed on directly or indirectly in any form to any other person or published, copied, in whole or in part, for any purpose unless otherwise expressly authorised. This service / information is not directed or intended for distribution to, or use by, any person or entity who is a citizen or resident of or located in any locality, state, country or other jurisdiction, where such distribution, publication, availability or use would be contrary to law, regulation or which would subjectBajaj Financial Securities Limited and affiliates/ group/holding companies to any registration or licensing requirements within such jurisdiction. The distribution of this document in certain jurisdictions may be restricted by law, and persons in whose possession this document comes, should inform themselves about and observe any such restrictions.
The data would be provided to the clients on an "as is" and "where-is" basis, without any warranty. Bajaj Financial Securities Limited or its subsidiaries and associated companies shall not be liable for any delay or any other interruption which may occur in providing the data due to any reason including network (Internet) reasons or snags in the system, breakdown of the system or any other equipment, server breakdown, maintenance shutdown, breakdown of communication services or inability of the Bajaj Financial Securities Limited or its subsidiaries and associated companies to provide the data. In no event shall the Bajaj Financial Securities Limited or its holding and associated companies be liable for any damages, including without limitation direct or indirect, special, incidental, or consequential damages, losses or expenses arising in connection with the data provided by the Bajaj Financial Securities Limited or its holding and associated companies.
ADDITIONAL DISCLAIMER FOR U.S. PERSONS
Bajaj Financial Securities Limited is not a registered broker-dealer under the U.S. Securities Exchange Act of 1934, as amended (the"1934 act") and under applicable state laws in the United States. In addition, Bajaj Financial Securities Limited is not a registered investment adviser under the U.S. Investment Advisers Act of 1940, as amended (the "Advisers Act" and together with the 1934 Act, the "Acts), and under applicable state laws in the United States. Accordingly, in the absence of specific exemption under the Acts, any brokerage and investment services provided by Bajaj Financial Securities Limited, including the products and services described herein are not available to or intended for U.S. persons. This email message does not constitute an offer or invitation to purchase or subscribe for any securities or solicitation of any investments or investment services and/or shall not be considered as an advertisement tool. "U.S. Persons" are generally defined as a natural person, residing in the United States or any entity organized or incorporated under the laws of the United States. US Citizens living abroad may also be deemed "US Persons" under certain rules.
ADDITIONAL DISCLAIMER FOR CANADIAN PERSONS
Bajaj Financial Securities Limited is not a registered adviser or dealer under applicable Canadian securities laws nor has it obtained an exemption from the adviser and/or dealer registration requirements under such law. Accordingly, any brokerage and investment services provided by Bajaj Financial Securities Limited, including the products and services described herein are not available to or intended for Canadian persons.
This mailer and its respective contents do not constitute an offer or invitation to purchase or subscribe for any securities or solicitation of any investments or investment services.
DISCLAIMER FOR REPORT DISCLOSURES UNDER THE PROVISIONS OF SEBI (RESEARCH ANALYSTS) REGULATIONS 2014 (REGULATIONS)
Bajaj Financial Securities Limited ("Bajaj Broking" or "Research Entity") is regulated by the Securities and Exchange Board of India ("SEBI") and is licensed to carry on the business of broking, depository services and related activities.
This Report has been prepared by Bajaj Financial Securities Limited in the capacity of a Research Analyst having SEBI Registration No. INH000010043 and distributed as per SEBI (Research Analysts) Regulations 2014. This report does not constitute an offer or solicitation for the purchase or sale of any financial instrument or as an official confirmation of any transaction. The information contained herein is from publicly available data or other sources believed to be reliable. This report is provided for assistance only and is not intended to be and must not alone be taken as the basis for an investment decision. The user assumes the entire risk of any use made of this information. Each recipient of this report should make such investigation as it deems necessary to arrive at an independent evaluation of an investment in the securities of companies referred to in this document (including the merits and risks involved), and should consult his own advisors to determine the merits and risks of such investment. The investment discussed or views expressed may not be suitable for all investors.
This information is strictly confidential and is being furnished to you solely for your information. This information should not be reproduced or redistributed or passed on directly or indirectly in any form to any other person or published, copied, in whole or in part, for any purpose. This report is not directed or intended for distribution to, or use by, any person or entity who is a citizen or resident of or located in any locality, state, country or other jurisdiction, where such distribution, publication, availability or use would be contrary to law, regulation or which would subject Bajaj Financial Securities Limited and associates / group companies to any registration or licensing requirements within such jurisdiction. The distribution of this report in certain jurisdictions may be restricted by law, and persons in whose possession this report comes, should observe, any such restrictions. The information given in this report is as of the date of this report and there can be no assurance that future results or events will be consistent with this information. This information is subject to change without any prior notice. Bajaj Financial Securities Limited reserves the right to make modifications and alterations to this statement as may be required from time to time. Bajaj Financial Securities Limited or any of its associates / group companies shall not be in any way responsible for any loss or damage that may arise to any person from any inadvertent error in the information contained in this report. Bajaj Financial Securities Limited is committed to providing independent and transparent recommendation to its clients. Neither Bajaj Financial Securities Limited nor any of its associates, group companies, directors, employees, agents or representatives shall be liable for any damages whether direct, indirect, special or consequential including loss of revenue or lost profits that may arise from or in connection with the use of the information. Our proprietary trading and investment businesses may make investment decisions that are inconsistent with the recommendations expressed herein. Past performance is not necessarily a guide to future performance .The disclosures of interest statements incorporated in this report are provided solely to enhance the transparency and should not be treated as endorsement of the views expressed in the report. The information provided in these reports remains, unless otherwise stated, the copyright of Bajaj Financial Securities Limited. All layout, design, original artwork, concepts and other Intellectual Properties, remains the property and copyright of Bajaj Financial Securities Limited and may not be used in any form or for any purpose whatsoever by any party without the express written permission of the copyright holders.
We offer our research services to clients as well as our prospects. Though this report is disseminated to all the customers simultaneously, not all customers may receive this report at the same time. We will not treat recipients as customers by virtue of their receiving this report.
Bajaj Financial Securities Limited and its associates, officer, directors, and employees, research analyst (including relatives) worldwide may: (a) from time to time, have long or short positions in, and buy or sell the securities thereof, of company(ies), mentioned herein or (b) be engaged in any other transaction involving such securities and earn brokerage or other compensation or act as a market maker in the financial instruments of the subject company/company(ies) discussed herein or act as advisor or lender/borrower to such company(ies) or have other potential/material conflict of interest with respect to any recommendation and related information and opinions at the time of publication of research report or at the time of public appearance. Bajaj Financial Securities Limited may have proprietary long/short position in the above-mentioned scrip(s) and therefore should be considered as interested. The views provided herein are general in nature and do not consider risk appetite or investment objective of any particular investor; readers are requested to take independent professional advice before investing. This should not be construed as invitation or solicitation to do business with Bajaj Financial Securities Limited.
Bajaj Financial Securities Limited or its associates may have received compensation from the subject company in the past 12 months. Bajaj Financial Securities Limited or its associates may have managed or co-managed public offering of securities for the subject company in the past 12 months. Bajaj Financial Securities Limited or its associates may have received compensation for investment banking or merchant banking or brokerage services from the subject company in the past 12 months. Bajaj Financial Securities Limited or its associates may have received any compensation for products or services other than investment banking or merchant banking or brokerage services from the subject company in the past 12 months. Bajaj Financial Securities Limited or its associates have not received any compensation or other benefits from the Subject Company or third party in connection with the research report. Research analyst or his/her relative or Bajaj Financial Securities Limited’s associates may have financial interest in the subject company. Bajaj Financial Securities Limited, its associates, research analyst and his/her relative may have other potential/material conflict of interest with respect to any recommendation and related information and opinions at the time of publication of research report or at the time of public appearance.
Research analyst has served as an officer, director or employee of subject Company: No
Bajaj Financial Securities Limited has financial interest in the subject companies: No
Bajaj Financial Securities Limited’s Associates may have actual/beneficial ownership of 1% or more securities of the subject company at the end of the month immediately preceding the date of publication of research report.
Research analyst or his/her relative has actual/beneficial ownership of 1% or more securities of the subject company at the end of the month immediately preceding the date of publication of research report: No
Bajaj Financial Securities Limited has actual/beneficial ownership of 1% or more securities of the subject company at the end of the month immediately preceding the date of publication of research report: No
Subject company may have been client during twelve months preceding the date of distribution of the research report.
There were no instances of non-compliance by Bajaj Financial Securities Limited on any matter related to the capital markets, resulting in significant and material disciplinary action during the last three years. A graph of daily closing prices of the securities is also available at NSE
ANALYST CERTIFICATION
The analyst for this report certifies that all of the views expressed in this report accurately reflect his or her personal views about the subject company or companies and its or their securities, and no part of his or her compensation was, is or will be, directly or indirectly related to specific recommendations or views expressed in this report.
RISK DISCLOSURE ON DERIVATIVES
SEBI study dated January 25, 2023 on “Analysis of Profit and Loss of Individual Traders dealing in equity Futures and Options (F&O) Segment”, wherein Aggregate Level findings are based on annual Profit/Loss incurred by individual traders in equity F&O during FY 2021-22.
BROKERAGE DISCLAIMER
All leveraged intraday positions will be squared off on the same day. There is no restriction on the withdrawal of the unutilised margin amount. Brokerage will not exceed the SEBI prescribed limit. Visit : Pricing
MTF
As subject to the provisions of SEBI Circular CIR/MRD/DP/54/2017 dated June 13, 2017, and the terms and conditions mentioned in the lights and obligations statement issued by the TM (if applicable).
US INVESTING
International investment is not supervised by any regulatory body in India. Thus, any claim or dispute relating to such investment or enforcement of any agreement/contract /claim will not be under laws and regulations of the recognized stock exchanges and investor protection under Indian Securities Law. The account opening process will be carried out on Vested platform and Bajaj Financial Securities Limited will not have any role in it.
IPO
This should not be construed as soliciting investment. Investors’ discretion is required. Kindly consult your financial expert before investing. No need to issue cheques by investors while subscribing to IPO. Investments in securities markets are subject to market risks, read all the related documents carefully before investing.
SCREENERS
Screeners is not Exchange-approved products and any disputes related to the same will not be dealt on the Exchange platform.
SECURITIES
Securities quoted are exemplary and not recommendatory.
IPV
Account would be open after all procedure relating to IPV and client due diligence is completed.
IMAGES
The images used are only for representation purpose. Proper due diligence has been done for the images and the image is not of any artist. The same is captured from royalty free sites.
THIRD PARTY PRODUCT DISCLAIMER
Bajaj Financial Securities Limited is a distributor for Non-Broking Products/Services such as Mutual Funds, Mutual Funds SIP, IPO, Bonds, Insurance, PMS, Global Investing, any other third-party products/services. These are not Exchange Traded Products, and we are only acting as distributors. All disputes with respect to the distribution activity, would not have access to SCORES/ODR, Exchange investor redressal forum or Arbitration mechanism. Please refer to the detailed disclaimer for Third-Party Products.
As per SEBI circular no. SEBI/HO/MIRSD/MIRSD-PoD-1/P/CIR/2023/84 dated June 08, 2023, Stockbrokers are required to upstream the entire client funds lying with them to the Clearing Corporation. Based on client’s request the funds’ release request must be placed with the Clearing Corporation. Based on the internal process and cut-off timelines of the Clearing Corporation the funds will be released to the Stock Broker. In view of this new process, as specified by the regulatory and the cut-off time of Clearing Corporation/Banks processing the funds, Bajaj Financial Securities Limited cannot commit the exact time for releasing funds payout to its client. Clients are requested to note that, Bajaj Financial Securities Limited will not be responsible for any inconvenience caused to clients due to delay in release of funds payout, including fines, delayed charges, defaults, etc.