Shareholding Pattern: Promoter, FII and DII Trend Over 4 Quarters
SBI Bank's shareholding pattern provides information about ownership by promoters, foreign institutional investors (FIIs), domestic institutional investors (DIIs), and public shareholders.
The stated FII holding increased from 9.57% in September 2025 to 10.81% in June 2026. DII holding moved from 27.65% to 26.52% over the same period. Public and other shareholding stood at 7.06% in June 2026, while promoter holding was reported at 55.47%.
| Shareholding Pattern | Sep 2025 | Dec 2025 | Mar 2026 | Jun 2026 |
|---|
| Promoters | 55.50% | 55.50% | 55.52% | 55.47% |
|---|
| FIIs | 9.57% | 10.34% | 11.41% | 10.81% |
|---|
| DIIs | 27.65% | 27.04% | 26.11% | 26.52% |
|---|
| Public & Others | 7.13% | 6.97% | 6.81% | 7.06% |
|---|
(Source: Screener)
SBI Bank Share Price Outlook for 2026, 2027, 2028 and 2030
SBI Bank's future financial performance will depend on book value growth, earnings, deposit growth, lending activity and valuation multiples.
Over the past five years, the bank has reported changes in revenue, profit and net interest margins. Its FY26 figures include revenue of ₹5,14,933 crore, an NIM of 2.91% and a net profit of ₹86,666 crore.
The projections use an assumed growth rate. Earnings, valuation multiples, interest rates, market sentiment, and other financial and economic factors may affect actual share prices.
Peer Comparison Within the Banks Sector
SBI operates in a banking sector that includes public and private sector banks. HDFC Bank, Axis Bank and ICICI Bank are among its competitors across deposits, lending and other banking services.
SBI accounts for approximately 30% of the total installed base of ATMs and ADWMs. Its reported transaction volumes include 285.17 crore NEFT transactions, representing a 14.12% market share; 8.55 crore RTGS transactions, representing a 12.21% market share; and 106.53 crore IMPS transactions, representing a 21.68% market share.
SBI's total assets are stated at ₹76.26 lakh crore. HDFC Bank has total assets of ₹50 lakh crore, while ICICI Bank and Axis Bank have total assets of ₹30 lakh crore and ₹18 lakh crore, respectively.
The following table presents five stocks from the Nifty Bank index, along with their market capitalisation, sales and profit variance, and one-year and three-year returns.
| Stock Name | Market Cap (In ₹ cr) | Sales Variance of 3Y | Profit Variance 3Y | 3 Year Return | 1 Year Return |
|---|
| HDFC Bank | 10,88,861.37 | 15.68% | 18.06% | -2.03% | -25.28% |
|---|
| ICICI Bank | 9,44,256.37 | 17.85% | 16.58% | 11.51% | -4% |
|---|
| SBI | 8,86,892.07 | 19.94% | 14.38% | 17.10% | 10.01% |
|---|
| Kotak Mahindra | 4,14,727.15 | 17.46% | 8.94% | 6.25% | -0.42% |
|---|
| Axis Bank | 3,80,461.78 | 20.59% | 34.58% | 6.73% | 3.06% |
|---|
(Source: Screener)
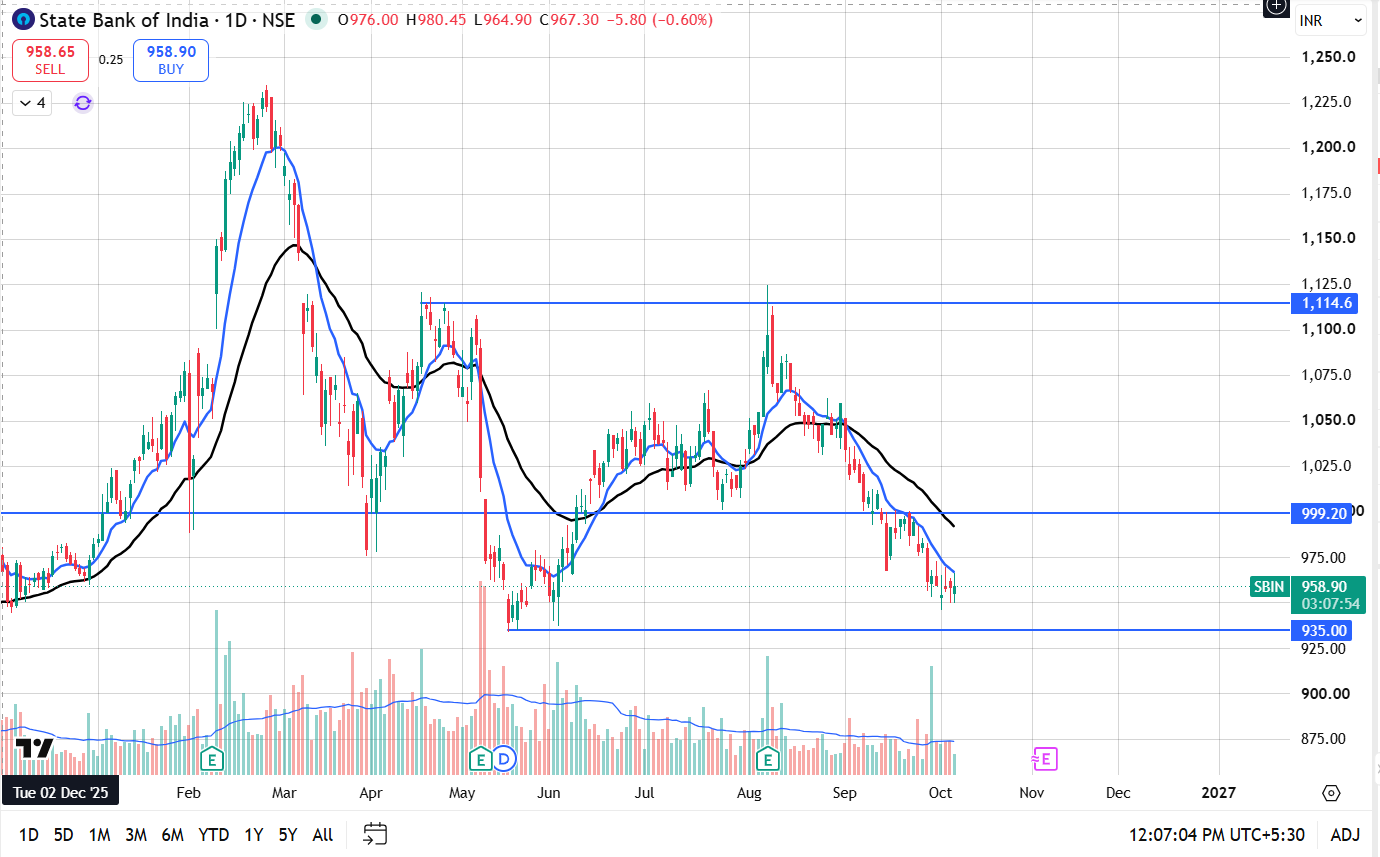
SBI Bank's market capitalisation was approximately ₹8,86,892.07 crore as of October 7, 2026, with a P/E ratio of around 10.5. Its reported three-year return was 17.1%, while its one-year return was 10.01%.
The table also reports a three-year sales variance of 19.94% and a three-year profit variance of 14.38% for SBI.
Key Risks: What Could Affect the Investment Thesis
Cost of Funds Pressure
Interest rates and deposit pricing influence a bank's net interest margin. If deposit costs increase faster than income generated from loans, the margin may narrow. Higher costs associated with term deposits can also affect funding expenses.
Growth in NPAs
Non-performing assets (NPAs) arise when borrowers do not meet repayment obligations according to applicable classification rules. An increase in NPAs can affect a bank's profitability and provisions. Asset quality is therefore an important factor in evaluating banking performance.
Macroeconomic and Geopolitical Risks
SBI's domestic and international operations face macroeconomic conditions, interest-rate changes, and developments affecting trade and financial markets. These factors can influence credit demand, borrower repayment capacity and foreign institutional investment flows.
SBI Bank Share Price: Key Factors to Consider in 2026
SBI recorded returns of 17.10% over three years and 10.01% over one year. The performance of the bank and the wider banking sector can be examined through financial results, valuation measures and changes in market conditions.
Over the last five years, SBI has reported changes in book value and revenue. Its total business has crossed ₹110 trillion, with deposits and advances above ₹60 trillion and ₹50 trillion, respectively, according to the source data.
State Bank of India reported a net profit of ₹21,121 crore in Q1 FY27, with a year-on-year (YoY) growth of 10.23%. Operating profit increased by 9.77% to ₹33,529 crore, alongside net interest income (NII) growth of 14.88% YoY.
The bank's reported return on assets (ROA) was 1.11%, while return on equity (ROE) was 17.87%. Whole-bank advances grew by 18.63% YoY, and domestic advances grew by 18.15% YoY. Domestic NIM increased by 7 basis points (bps) quarter-on-quarter (QoQ) to 3.00%, while whole-bank NIM increased by 5 bps QoQ to 2.86%.
SBI's brand, distribution network and range of financial services are relevant parts of its business profile. Their financial significance can be considered alongside operating costs, asset quality, deposit growth, profitability and capital adequacy.
SBI Credit Growth, NIM and Slippage Trend
In FY25, SBI's credit growth was reported at 12.03% YoY, with total advances of ₹42.21 lakh crore. SME credit grew by 16.86% YoY, alongside activity in agriculture credit.
Net interest income (NII) increased by 4.43% YoY to ₹1,66,965 crore. The reported NIM was 3.09% for the whole bank and 3.22% for domestic operations.
The source data also reports a gross NPA ratio of 1.82%, described as an increase of 42 bps YoY, and a net NPA ratio of 0.47%, described as a decrease of 10 bps YoY.
Credit growth reflects changes in the bank's lending activity. NIM represents the relationship between interest income and interest expenses, while slippages refer to loans newly classified as non-performing during a reporting period. These measures provide different information about lending, income generation and asset quality.
Value of SBI Subsidiaries: SBI Life, SBI Cards, SBI MF
1. SBI Life
SBI Life Insurance operates in India's life insurance sector. Its business includes individual and group insurance products distributed through multiple channels, including the bancassurance network associated with SBI.
The source data lists a market capitalisation of ₹1,73,243 crore, a stock P/E ratio of 66.6 and a return on equity (ROE) of 15%.
SBI Life's business performance can be considered through measures such as new business premiums, product mix, distribution channels and profitability.
2. SBI Cards
SBI Cards and Payment Services operates in the credit card sector. Its business includes issuing credit cards and providing related payment services.
The company operates in a market where unsecured credit growth, customer spending, delinquencies, funding costs and credit card margins can influence financial performance. HDFC Bank is another major participant in the credit card market.
3. SBI Mutual Funds
SBI Mutual Fund operates in India's asset management sector and manages mutual fund schemes across different investment categories. The source data lists assets under management (AUM) of ₹13,16,223.67 crore, market capitalisation of ₹1,01,882 crore, ROE of 43% and a stock P/E ratio of 32.8.
Asset management businesses generate revenue primarily through fees associated with assets under management and the products they offer. AUM, fee rates, operating expenses, product mix and market movements can influence their financial performance.
SBI Dividend History and PSU Bank Re-Rating
SBI declared a dividend of ₹15.90 per share for FY24–25 and ₹17.35 per share for FY25–26. The source data states that the bank distributes roughly 20% of its net income to shareholders.
Dividend payments are a way for companies to distribute a portion of their profits to eligible shareholders. Dividend yield changes with both the dividend amount and the share price.
The source data also refers to changes in the public sector banking system, including a gross NPA ratio of 1.82%, annual net income above ₹70,901 crore and capital buffers associated with lending activity.
A re-rating refers to a change in the valuation multiple at which the market values a company. Changes in profitability, asset quality, capital requirements, interest rates and market expectations can influence valuation multiples.