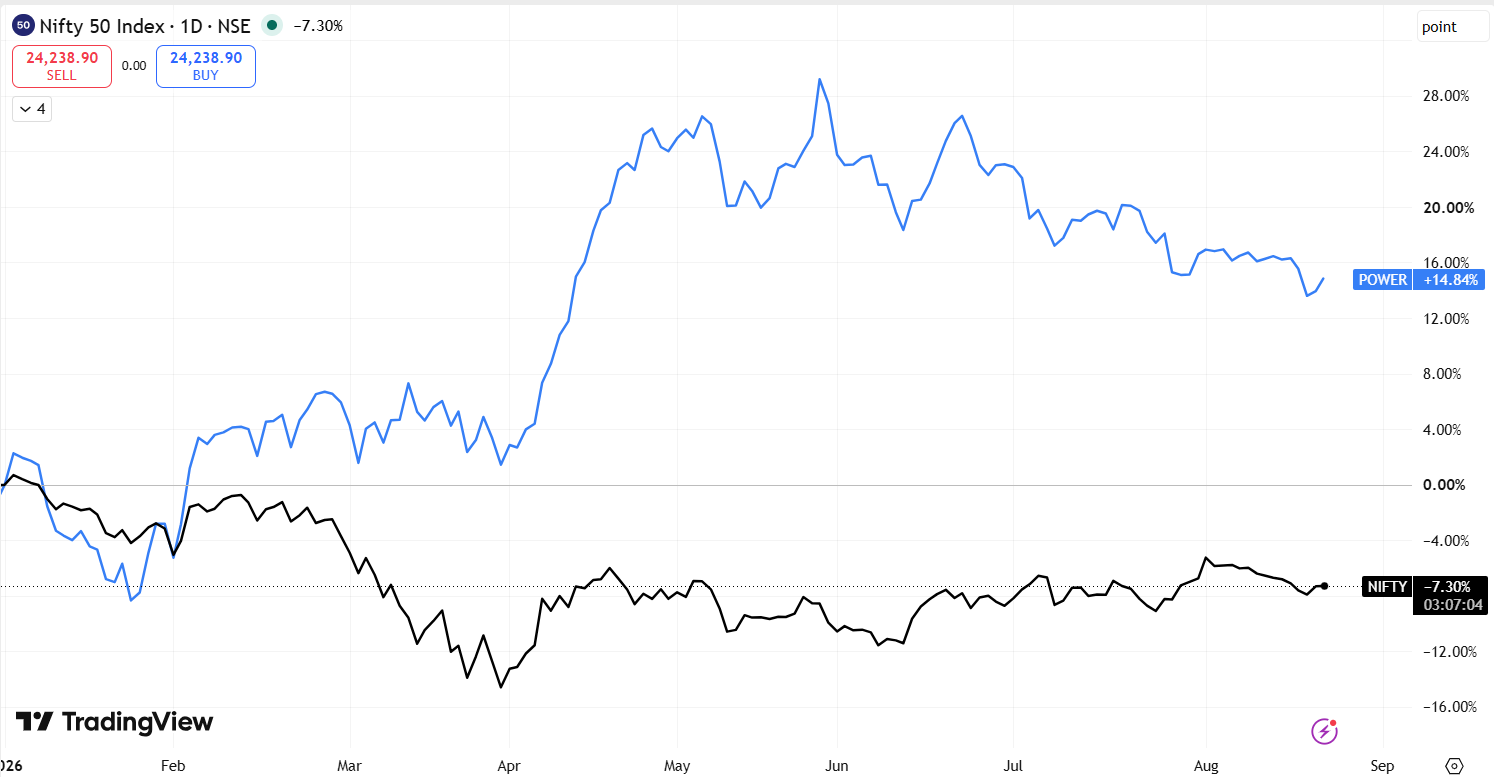
However, the sector’s rally moderation started after reaching its peak around May and June as investors booked profits. Despite the correction from highs, the BSE Power Index continues to trade around 14.9% higher from the beginning of the year, showing that the broader trend remains positive.
This widening disparity can be seen in the returns generated by different firms from the generation, transmission and renewable power segments, depending on their prospects and valuations.
Power Stocks in India 2026: Market Cap, P/E and 1-Year Return
The power stocks list in India includes companies across thermal generation, renewable energy, transmission, hydropower and integrated utilities. Since each segment follows a different business model, market capitalisation and share price performance alone do not provide the complete picture. Valuations, earnings visibility and future capacity expansion plans also play an important role in assessing companies within the sector.
The table below compares leading power companies based on market capitalisation, P/E ratio and 1-year returns. The market capitalisation, valuation and return figures are sourced from Screener and are as of August 21, 2026. The data provides a snapshot of how companies within the power sector have performed differently despite benefiting from the broader electricity demand and energy transition themes.
Company
| Main Business
| Market Cap (₹ crore)
| P/E
| 1-Year Return
|
Adani Power
| Thermal generation
| 3,92,829
| 27.6
| 71.10%
|
NTPC
| Integrated generation
| 3,29,784
| 11.9
| -0.38%
|
Power Grid Corp.
| Transmission
| 2,52,837
| 15.9
| -6.76%
|
Adani Green Energy
| Renewable generation
| 2,16,241
| 112
| 34.70%
|
Tata Power
| Integrated utility
| 1,20,129
| 30.7
| -3.30%
|
JSW Energy
| Thermal and renewables
| 1,00,512
| 50.1
| 3.97%
|
NTPC Green Energy
| Renewable generation
| 77,531
| 128
| -11.20%
|
NHPC
| Hydropower
| 76,794
| 20.2
| -6.70%
|
Torrent Power
| Generation and distribution
| 62,975
| 27.1
| -3.34%
|
NLC India
| Mining and power generation
| 37,717
| 11.7
| 14.80%
|
SJVN
| Hydro and renewable power
| 26,015
| 40.7
| -32.30%
|
(Source: PIB, Ministry of Power, CEA, NTPC, Adani Green Energy, Tata Power, PowerGrid)
There have been significant differences in performance levels among major firms in the electricity sector. Adani Power gained 71.10% in 1 year, followed by Adani Green Energy with a gain of 34.70%. Meanwhile, NTPC Green Energy declined 11.20% during the period. The variation in returns reflects differences in business segments, earnings growth and investor expectations around conventional and renewable energy businesses.
Valuations also differ significantly across power companies. Traditional utility firms such as NTPC and NLC India traded at lower P/E multiples of 11.9 times and 11.7 times, respectively, while renewable energy companies such as Adani Green Energy and NTPC Green Energy commanded higher valuations of 112 times and 128 times. The valuation gap reflects market expectations of stronger long-term growth potential in renewable energy.
Key Growth Drivers for the Power Sector in FY27
1. Electricity Consumption Keeps Climbing
Demand for power in India is not slowing down. The CEA has estimated peak electricity demand at 277.2 GW for FY27, up from 260.1 GW in FY26. That kind of incremental demand has to be met somehow and it keeps the entire value chain busy.
2. Renewable Capacity Addition Gathering Pace
India added 17.04 GW of renewable energy capacity between April and July 2026 alone, pushing total renewable capacity including large hydro to 291.73 GW. That pace of addition is good news for renewable developers and equally good for the companies supplying the equipment, grid connections and other infrastructure that makes those projects work.
3. Transmission Cannot Be an Afterthought
More generation capacity, whether from renewables or conventional sources, needs wires to carry it. The transmission network expansion planned through 2032 is a long runway of opportunity for transmission utilities and power equipment manufacturers. Grid buildout tends to be less glamorous than generation, but it is just as necessary.
4. Thermal Power is Not Going Anywhere Yet
Despite the renewable push, coal and lignite-based power stations supplied 69.54% of electricity generated in India during April to June 2026. Thermal plants provide the steady base-load supply that solar and wind simply cannot guarantee around the clock. That role is not disappearing in the near term regardless of how quickly renewables scale up.
5. Storage Moving from Optional to Essential
The more solar and wind capacity India adds, the more pressing the storage question becomes. Generation that fluctuates with weather conditions needs somewhere to go when supply exceeds demand. Battery storage and pumped hydro projects are moving up the priority list as grid managers look for ways to keep supply and demand in balance across longer periods.
Power Sector Valuation: P/E, P/B and EV/EBITDA vs 5-Year Median
As of August 21, 2026, power stocks are trading at varied valuations due to differences in business models, growth prospects and earnings visibility. The table below compares the current valuations of select power companies with their five-year median levels.
Company
| Current P/E
| 5Y Median P/E
| Current P/B
| 5Y Median P/B
| Current EV/EBITDA
| 5Y Median EV/EBITDA
|
NTPC
| 11.9
| 13.2
| 1.62
| 1.7
| 9.84
| 8.8
|
Power Grid
| 15.9
| 15.5
| 2.57
| 2.5
| 10.9
| 8.8
|
Tata Power
| 30.7
| 31.4
| 3.1
| 3.4
| 10.6
| 11.3
|
JSW Energy
| 50.2
| 44.9
| 3.15
| 3.3
| 15.5
| 17.7
|
NHPC
| 20.2
| 20.4
| 1.86
| 1.8
| 16
| 14.6
|
Adani Power
| 27.7
| 15.6
| 6.12
| 4.9
| 17.2
| 10.7
|
(Source: PIB, Ministry of Power, CEA, NTPC, Adani Green Energy, Tata Power, PowerGrid)
Among established utilities, NTPC is trading below its historical P/E range, with a current P/E of 11.9 times compared with its five-year median of 13.2 times. Tata Power is broadly in line with its historical valuation at 30.7 times P/E versus a median of 31.4 times, while Power Grid’s valuation remains close to its past averages.
Some companies continue to command higher valuations. Adani Power’s P/E has expanded to 27.7 times compared with its five-year median of 15.6 times, while JSW Energy trades at 50.2 times against its median of 44.9 times.
The valuation gap shows that power companies cannot be compared only on P/E ratios. Factors such as business model, growth plans, leverage and future earnings potential also influence how the market values each company.
Government Policy and Regulation Shaping the Power Sector
Government policies continue to play an important role in influencing investments in renewable power generation, power storage and transmission and distribution. The focus is gradually being shifted from capacity expansion to improving grid efficiency.
1. Rising Renewable Purchase Obligations:
In FY27, the Ministry of Power has set the minimum renewable energy consumption target at 35.95%, whereas the same was 33.01% in FY26. The increasing pressure can be helpful in raising the demand for renewable energy.
2. Push for Energy Storage:
The battery energy storage system is gaining significance in the Indian energy sector because of the growing capacity of renewable energy. The viability gap funding scheme for Battery Energy Storage System worth ₹3,760 crore has been increased to 13.8 GWh.
3. Distribution Sector Reforms:
Modernising the distribution sector and making it efficient is a crucial objective of the government in the coming years. As part of RDSS, efforts are being made by the government to modernise the distribution network and improve efficiency levels. The loss of AT&C has reduced from 21.91% in FY21 to 15.04% in FY25.
These policy measures are directing investment across renewable generation, transmission, storage and distribution infrastructure, widening the opportunity across the power value chain.
Risks Investors Should Price In
The long-term outlook for India's power sector looks encouraging, but the risks sitting underneath that positive surface are real and worth understanding before putting money to work.
1. DISCOM Financial Health
This one has been a thorn in the sector's side for years. AT&C losses have come down from 21.91% in FY21 to 15.04% in FY25, which is progress, but distribution companies still delay payments regularly. For power generators sitting on the other end of that transaction, late payments create cash flow pressure that does not always show up immediately in quarterly numbers.
2. Integrating Renewables Is More Complex Than It Looks
Adding more solar and wind to the grid sounds straightforward until you realise the infrastructure behind it needs to keep pace. Without better forecasting systems, storage capacity and grid upgrades, renewable projects risk being curtailed even when they are generating power. That is capacity sitting idle and returns taking a hit.
3. Fuel Price and Supply Uncertainty
Thermal power companies live with this risk constantly. Domestic coal supply is not always reliable and companies dependent on imported coal are exposed to whatever is happening with international prices and freight costs at any given point. Neither is easy to hedge perfectly.
4. Regulatory and Tariff Changes
Power is one of the more regulated sectors you can invest in. Tariff revisions, changes to renewable purchase obligations or adjustments to transmission charges can shift the earnings picture fairly quickly. What looks like a comfortable margin today can narrow if the regulatory environment shifts.
5. Capex and Valuation Risk
Power projects are capital-heavy and take years to complete. Cost overruns happen, financing costs can rise and if the market has already priced in aggressive growth, any execution slip tends to get punished harder than usual. Premium valuations leave little room for disappointment.
How to Invest in Power Stocks: Direct Equity vs Sector Funds vs ETFs
There is no single right way to get into the power theme. It comes down to how hands-on you want to be and how much company-specific risk you can stomach.
1. Direct Equity
Buying individual stocks gives you the most control, letting you choose between generation, transmission or renewable names. The catch is that returns depend on company-level factors like debt, execution and valuation. It takes more research and ongoing attention than the other routes.
2. Sectoral or Thematic Mutual Funds
Sectoral funds spread exposure across multiple companies, but AMFI is clear that they carry higher concentration risk than diversified funds. The fund's actual holdings also matter. The Tata Resources and Energy Fund had power at just 18.92 per cent of its portfolio as of July 31, 2026, with the rest in metals, oil and gas and other sectors. Energy funds are not always pure power plays.
3. ETFs and Index Funds
ETFs give you a basket of stocks in one transaction. But check the underlying index carefully. The Nifty Energy Index includes petroleum and gas alongside power companies, making it a broader energy bet rather than a focused power-sector position.
The choice really comes down to whether you want targeted power exposure or a wider energy theme that happens to include it.
Regulated Returns vs Merchant Power: Two Very Different Earnings Models
Power companies do not earn all revenue in the same way. Some operate under regulated tariffs or long-term contracts, while others depend on market-linked electricity prices.
Earnings model
| How revenue is earned
| Earnings visibility
| Main sensitivity
|
Regulated/contracted power
| Tariffs or long-term PPAs
| Relatively high
| Plant availability, regulation, fuel pass-through and project costs
|
Merchant power
| Short-term bilateral contracts or power exchanges
| Lower
| Spot power prices, demand-supply conditions and fuel costs
|
Under the regulated model, companies recover approved costs through tariffs, providing relatively stable earnings visibility. CERC’s Tariff Regulations for 2024-29 allow a base return on equity of 15.5% for existing thermal generating stations and transmission systems.
Merchant power companies, however, benefit when electricity demand is strong and supply is tight, but their earnings can fluctuate when market prices soften. Therefore, the mix of regulated, contracted and merchant capacity is an important factor when comparing power companies.
India’s 500 GW Renewable Target and Who Actually Benefits
India's clean-energy goal is commonly described as a 500 GW renewable target, but the actual aim is somewhat broader- 500 GW of non-fossil fuel installed capacity by 2030, covering solar, wind, hydro, bio-power and nuclear. As of July 31, 2026, India had crossed 300.50 GW of non-fossil capacity, per MNRE data, with solar leading the way at 164.59 GW.
What makes this story interesting for investors is that the opportunity does not stop at renewable generation. Getting power from a solar farm in Rajasthan to a factory in Tamil Nadu requires transmission infrastructure and Power Grid Corporation sits right in the middle of that need. Adani Green Energy, NTPC and Tata Power are all pushing their clean-energy pipelines harder, but the wires carrying that power matter just as much as the panels generating it.
Storage is the piece that often gets overlooked. Solar and wind are inherently intermittent; the sun does not always shine when demand peaks. As renewable capacity grows, battery storage, pumped hydro and smarter grid infrastructure become less optional and more essential. Companies positioning themselves here early could find themselves in a decent spot as the 2030 deadline draws closer.
So the 500 GW theme is really three stories running in parallel: generation, transmission and storage; each carries its own investment angle worth looking at separately.