MTF Stock Pick | Eternal | Base Formation Near ₹280–₹270 | Bajaj Broking Research
By Bajaj Broking Team
 December 10, 2025
 2 mins read
Market News


Synopsis:
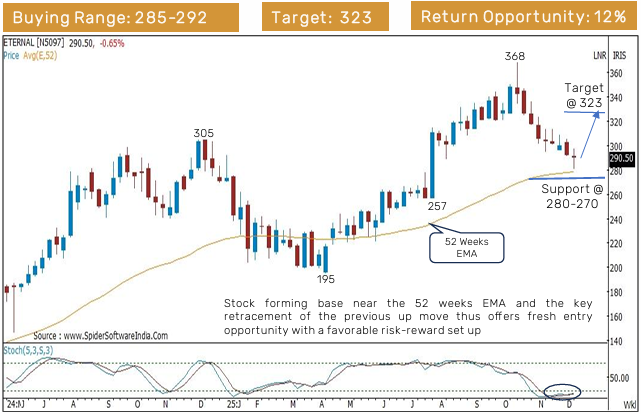
Eternal has been in a two–three month corrective phase and is now forming a base near the ₹280–₹270 demand zone, supported by key technical factors such as the 80% retracement of the prior up move, the 52-week EMA, and the bullish gap of 22 July 2025. Weekly chart structure indicates a time-extended but shallow pullback, while momentum indicators particularly the weekly stochastic show early improvement from oversold levels. The ₹323 region stands out as an important technical reference zone based on Fibonacci alignment and past price action.
Technical Outlook
Eternal has been in a corrective phase over the past two to three months and is now consolidating around a major demand zone, as highlighted in the technical study. The stock is forming a base between ₹280–₹270, an area reinforced by multiple supporting indicators.
The following confluence strengthens the significance of this zone:
80% retracement of the July–October 2025 up move (₹257 → ₹368)
52-week EMA positioned around ₹278
Presence of the bullish gap area on the 22 July 2025 daily chart
These overlapping factors suggest that the stock is undergoing a base-building phase, which often precedes directional movement but does not indicate certainty of any outcome.
Time–Price Behaviour and Structural View
A notable observation from the weekly chart is the time–price relationship. Eternal has taken 9 weeks to retrace approximately 80% of the prior 11-week rally, indicating a shallow yet time-extended correction. This pattern is interpreted as part of a higher-base structure forming after the earlier uptrend.
The report highlights ₹323 as an important technical reference level, as it corresponds with:
The 50% Fibonacci retracement of the decline from ₹368 → ₹280
The November 2025 high, creating a key overhead zone for future price action
These levels are referenced strictly as part of the technical framework.
Momentum Indicators
Momentum readings show improvement. The weekly stochastic oscillator has rebounded from oversold territory and recently formed a bullish crossover above its 3-period moving average. This indicates strengthening momentum while the broader structure remains in consolidation.
Key Technical Levels
Parameter | Levels / Details |
Buying Range (MTF) | ₹285 – ₹292 |
Support Zone | ₹280 – ₹270 |
Reference Level | ₹323 |
Indicative Return Metric | 12% |
Time Horizon | 6 months |
All levels above are reproduced exactly as stated in the source research document.
Conclusion
Based entirely on the technical observations, Eternal is undergoing a base-forming phase near a structurally important demand region. Momentum is beginning to stabilise, and the broader chart structure reflects a time-extended corrective pattern, with ₹323 emerging as a relevant reference area for future price action. These findings represent a technical study rather than any directional view or investment guidance, and should be interpreted strictly within the context of the source research document.

Published Date :
10 Dec 2025
Disclaimer :
Investments in the securities market are subject to market risk, read all related documents carefully before investing. This content is for educational purposes only. Securities quoted are exemplary and not recommendatory.
The information on this website is provided on "AS IS" basis. Bajaj Broking (BFSL) does not warrant the accuracy of the information given herein, either expressly or impliedly, for any particular purpose and expressly disclaims any warranties of merchantability or suitability for any particular purpose. While BFSL strives to ensure accuracy, it does not guarantee the completeness, reliability, or timeliness of the information. Users are advised to independently verify details and stay updated with any changes.
The information provided on this website is for general informational purposes only and is subject to change without prior notice. BFSL shall not be responsible for any consequences arising from reliance on the information provided herein and shall not be held responsible for all or any actions that may subsequently result in any loss, damage and or liability. Interest rates, fees, and charges etc., are revised from time to time, for the latest details please refer to our Pricing page.
Neither the information, nor any opinion contained in this website constitutes a solicitation or offer by BFSL or its affiliates to buy or sell any securities, futures, options or other financial instruments or provide any investment advice or service.
BFSL is acting as distributor for non-broking products/ services such as IPO, Mutual Fund, Insurance, PMS, and NPS. These are not Exchange Traded Products. For more details on risk factors, terms and conditions please read the sales brochure carefully before investing.
Content Partner - Dalal Street Investment Journal Wealth Advisory Private Limited
This article is for educational purposes only and should not be considered investment advice. Market investments are subject to risks. DSIJ Wealth Advisory Private Limited is a SEBI-registered Research Analyst (Reg. No: INH000006396) and Investment Adviser (Reg. No: INA000001142). Please consult your financial adviser before investing.
For more disclaimer, check here : https://www.bajajbroking.in/disclaimer


Read More Blogs


Our Secure Trading Platforms
Level up your stock market experience: Download the Bajaj Broking App for effortless investing and trading


Products

Calculators
Mutual Funds & SIP
Important Links
Corporate
Popular Stocks
Indian Indices
Global Indices
Sector Wise Stocks


