BAJAJ BROKING

Notification close image
No new Notification messages
card image
Oswal Pumps IPO is Open!
Apply for the Oswal Pumps IPO through UPI in just minutes.
delete image
card image
Start your SIP with just ₹100
Choose from 4,000+ Mutual Funds on Bajaj Broking
delete image
card image
Open a Free Demat Account
Pay ZERO maintenance charges for the first year, get free stock picks daily, and more.
delete image
card image
Trade Now, Pay Later with up to 4x
Never miss a good trading opportunity due to low funds with our MTF feature.
delete image
card image
Track Market Movers Instantly
Stay updated with real-time data. Get insights at your fingertips.
delete image

Long Wick Candlesticks: Analysis & Trading Strategies

Candlestick charts are a crucial component in technical analysis, offering traders a visual representation of price movements over time. Among the various candlestick patterns, long wick candles are particularly noteworthy due to their potential to indicate market reversals or continuation of trends. Understanding these patterns can greatly enhance your ability to make informed trading decisions.

Types of Long Wick Candles

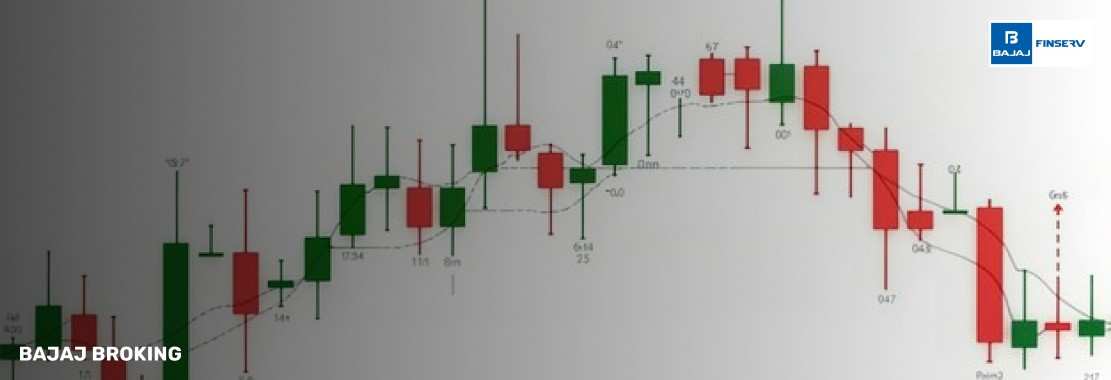
Long wick candles, also known as "shadow candles," refer to candlesticks that have long upper or lower wicks, indicating significant price movement within the time period of the candle. A wick, or shadow, represents the difference between the opening or closing price and the highest or lowest price during that period.

There are two primary types of long wick candles:

  1. Long Upper Wick Candles – These occur when the price rises significantly during the trading period but fails to close near the high. The long upper wick signifies rejection at higher prices.

  2. Long Lower Wick Candles – These candles form when the price falls substantially but fails to close near the low. The long lower wick indicates rejection at lower prices, suggesting potential for upward price movement.

Significance of Long Upper Wick Candles

A long upper wick candle often signifies that the market attempted to push higher but faced resistance, leading to a retracement or reversal before the close. This pattern can occur in both bullish and bearish trends, and its significance depends on the context of the market.

  • In a Bullish Trend: A long upper wick in an uptrend may indicate that the bulls tried to push prices higher but were met with strong selling pressure, potentially signaling a reversal or at least a pullback.

  • In a Bearish Trend: A long upper wick in a downtrend may show that sellers pushed the price lower but the bulls stepped in, creating an opportunity for a price rally.

Traders often consider the size of the wick in relation to the body of the candle. The longer the upper wick compared to the body, the more significant the potential reversal. For instance, when a long upper wick occurs at the peak of an uptrend, it is often seen as a signal to sell.

Significance of Long Lower Wick Candles

On the other hand, a long lower wick candle suggests that the price fell significantly during the trading period but closed near the opening price or even higher. This pattern indicates that buyers were able to reject lower prices and step in to push the price back up.

  • In a Bullish Trend: A long lower wick in an uptrend can suggest that there is strong support at lower price levels, and the market might continue to rise.

  • In a Bearish Trend: In a downtrend, a long lower wick can be interpreted as a potential reversal signal, as buyers may be stepping in at lower levels, rejecting further price drops.

This pattern signals market indecision, where sellers initially take control, but buyers eventually regain strength and close the price near the open or higher.

How to Identify Long Wick Candles

Identifying long wick candles on a chart requires attention to the candlestick's body and shadow. Here’s how to recognize them:

  1. Long Upper Wick Candles: Look for candles where the upper wick is significantly longer than the body. This indicates that the price attempted to move higher but was rejected before closing.

  2. Long Lower Wick Candles: These are candles where the lower wick is much longer than the body, signifying a sharp price decline that was later reversed by buying activity before the close.

  3. Ratio of Wick to Body: A key characteristic of long wick candles is the ratio between the wick and the body. A candle with a wick that is at least two or three times the length of the body is considered a long wick candle.

It’s important to confirm long wick candles with other indicators or patterns to avoid false signals, as they may not always result in reversals.

Trading Strategies Using Long Wick Candles

Long wick candles can be powerful signals for traders if used correctly. Here are some strategies for incorporating them into your trading plan:

  1. Reversal Trading:

    • Long Upper Wick: In an uptrend, a long upper wick can signal a reversal or pullback. Traders might consider shorting the asset or taking profits on long positions, especially if the candle appears near key resistance levels.

    • Long Lower Wick: In a downtrend, a long lower wick can indicate that the market has reached a level of support and is likely to reverse. A trader may enter a long position or buy the asset at this point, anticipating an upward move.

  2. Trend Continuation:

    • Long Upper Wick in a Bullish Trend: When a long upper wick forms during a strong uptrend, it might indicate short-term profit-taking, but the overall trend could continue. Traders could wait for the price to resume its upward movement before entering a new long position.

    • Long Lower Wick in a Bearish Trend: Similarly, a long lower wick in a downtrend can be a sign that the price is temporarily rejecting lower levels but might continue down after a brief rally.

  3. Support and Resistance Levels: Traders often combine long wick candles with key support and resistance levels. For instance, if a long lower wick appears near a significant support level, it can signal a buying opportunity. Conversely, a long upper wick near a resistance level can suggest a potential reversal or price rejection.

  4. Confirmation with Other Indicators: Always confirm long wick candles with other technical indicators such as RSI, MACD, or moving averages. For example, a long upper wick on a candlestick chart, combined with an overbought RSI, might strengthen the case for a reversal.

Conclusion

Long wick candlestick patterns are invaluable tools in technical analysis, providing traders with important insights into potential reversals or continuations. By understanding the significance of long upper and lower wicks, traders can make better-informed decisions.

However, like all candlestick patterns, long wick candles should not be traded in isolation. It is essential to use them alongside other indicators and market context to improve the accuracy of your trading decisions. With practice, identifying and trading based on long wick candles can significantly enhance your trading strategy and help you capture more profitable opportunities in the market.

Share this article: 

Frequently Asked Questions

No result found

search icon
investment-card-icon

What is Step-Up Bond

A step-up bond offers increasing interest payments over time. This structure benefits investors by providing higher yields as the bond matures.

investment-card-icon

What are Bullet Bonds

A bullet bond is a debt instrument that repays the full principal amount at maturity, with no periodic principal payments during its term.

investment-card-icon

Convertible Debentures

Convertible debentures offer fixed income with the option to convert into equity. Learn how they work, their types, and their benefits in corporate finance and investing.

investment-card-icon

Deep Discount Bonds

Deep discount bonds are issued at a price below face value and offer long-term growth potential. Learn how they work, their risks, and who should consider investing.

investment-card-icon

Non Convertible Debentures (NCDs)

Non-Convertible Debentures offer fixed returns with unique features. Get insights on types, buying process, and key factors to consider before investing in NCDs.

investment-card-icon

Indemnity Bond for Property

Get a clear insight into indemnity bonds for property, their importance, features, benefits, and how to calculate stamp duty effectively and confidently.

investment-card-icon

Different Types of Government Securities in India

Government securities like T-Bills, Bonds, and SDLs offer secure options for investors. See how each type works and contributes to a balanced portfolio.

investment-card-icon

How To Start Algorithmic Trading? Concepts & Examples

Start algorithmic trading with our step-by-step guide. Learn key strategies, tools, and platforms to launch your algo trading journey confidently.

investment-card-icon

What Are Partly Paid Shares? Meaning & Benefits

With partly paid shares, investors commit capital in phases. See how this structure functions, its strategic uses, and the risks involved in shareholding.

investment-card-icon

Money Market Instruments: Types, Features & Benefits

Money market instruments offer low-risk investment options. See their types, benefits, and how they provide liquidity and capital safety for short-term goals.

Disclaimer :

The information on this website is provided on "AS IS" basis. Bajaj Broking (BFSL) does not warrant the accuracy of the information given herein, either expressly or impliedly, for any particular purpose and expressly disclaims any warranties of merchantability or suitability for any particular purpose. While BFSL strives to ensure accuracy, it does not guarantee the completeness, reliability, or timeliness of the information. Users are advised to independently verify details and stay updated with any changes.

The information provided on this website is for general informational purposes only and is subject to change without prior notice. BFSL shall not be responsible for any consequences arising from reliance on the information provided herein and shall not be held responsible for all or any actions that may subsequently result in any loss, damage and or liability. Interest rates, fees, and charges etc., are revised from time to time, for the latest details please refer to our Pricing page.

Neither the information, nor any opinion contained in this website constitutes a solicitation or offer by BFSL or its affiliates to buy or sell any securities, futures, options or other financial instruments or provide any investment advice or service.

BFSL is acting as distributor for non-broking products/ services such as IPO, Mutual Fund, Insurance, PMS, and NPS. These are not Exchange Traded Products. For more details on risk factors, terms and conditions please read the sales brochure carefully before investing.

Investments in the securities market are subject to market risk, read all related documents carefully before investing. This content is for educational purposes only. Securities quoted are exemplary and not recommendatory.

[ Read More ]

For more disclaimer, check here : https://www.bajajbroking.in/disclaimer

Our Secure Trading Platforms

Level up your stock market experience: Download the Bajaj Broking App for effortless investing and trading

Bajaj Broking App Download

10 lakh+ Users

icon-with-text

4.4 App Rating

icon-with-text

4 Languages

icon-with-text

₹5100+ Cr MTF Book

icon-with-text
banner-icon

Open Your Free Demat Account

Enjoy low brokerage on delivery trades

+91

|

Please Enter Mobile Number

Open Your Free Demat Account

Enjoy low brokerage on delivery trades

+91

|