BAJAJ BROKING

Notification close image
No new Notification messages
card image
Oswal Pumps IPO is Open!
Apply for the Oswal Pumps IPO through UPI in just minutes.
delete image
card image
Start your SIP with just ₹100
Choose from 4,000+ Mutual Funds on Bajaj Broking
delete image
card image
Open a Free Demat Account
Pay ZERO maintenance charges for the first year, get free stock picks daily, and more.
delete image
card image
Trade Now, Pay Later with up to 4x
Never miss a good trading opportunity due to low funds with our MTF feature.
delete image
card image
Track Market Movers Instantly
Stay updated with real-time data. Get insights at your fingertips.
delete image

Pennant Pattern

Listen to our Podcast: Grow your wealth and keep it secure.

0:00 / 0:00

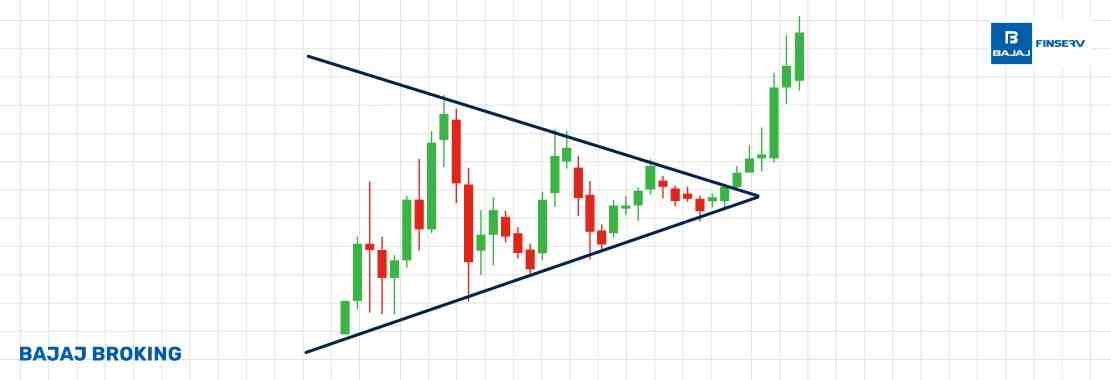
A pennant pattern is a technical analysis chart formation that emerges after a significant price movement, known as the flagpole. This pattern signifies a brief consolidation period where the price action forms a small symmetrical triangle, or pennant, before resuming in the direction of the initial trend. Traders view pennant patterns as indicators that the prevailing trend is likely to continue following this short pause.

What is a Pennant Pattern?

In technical analysis, a pennant pattern is recognized as a continuation pattern that appears after a substantial price move. Following this move, the price consolidates within converging trendlines, creating a pennant shape. This consolidation phase reflects a temporary market indecision before the price breaks out in the same direction as the preceding trend, signaling a continuation.

Types of Pennant Patterns

  1. Bullish Pennant Pattern: Forms after a strong upward price movement. During consolidation, the price creates a symmetrical triangle, indicating a potential continuation of the uptrend upon breakout.

  2. Bearish Pennant Pattern: Emerges following a sharp downward price movement. The consolidation phase forms a symmetrical triangle, suggesting that the downtrend may continue after the breakout.

Features of Pennant Chart Pattern

  • Converging Trendlines: The pattern is characterized by two converging trendlines that form a symmetrical triangle.

  • Volume: Typically, trading volume decreases during the consolidation phase and increases during the breakout.

  • Duration: Pennants are short-term patterns, usually lasting from one to three weeks.

Stages of Pennant Candlestick Pattern

  1. Flagpole: A significant price movement establishes the initial trend.

  2. Consolidation: The price enters a period of consolidation, forming a symmetrical triangle with converging trendlines.

  3. Breakout: The price breaks out from the pennant in the direction of the initial trend, often accompanied by increased volume.

How to Trade using Bullish and Bearish Pennants?

  • Identify the Pattern: Look for a strong price movement followed by a consolidation phase forming a symmetrical triangle.

  • Confirm the Breakout: Wait for the price to break above the upper trendline in a bullish pennant or below the lower trendline in a bearish pennant.

  • Volume Confirmation: Ensure that the breakout is accompanied by increased trading volume to validate the move.

  • Set Entry and Exit Points: Enter the trade at the breakout point and set stop-loss orders just outside the opposite trendline to manage risk.

Advantages and Disadvantages of Pennant Pattern

Advantages

Disadvantages

Provides clear entry and exit points following the breakout.

Risk of false breakouts leading to potential losses.

Applicable across various time frames and markets.

Requires confirmation from other indicators to increase reliability.

Helps in identifying continuation of existing trends.

Less effective in volatile or sideways markets where patterns are less distinct.

Pennant vs. Flag Patterns: What's the Difference?

Although flag and pennant patterns are continuation patterns, their formation is different:

  • Pennant Pattern: Features converging trendlines forming a small symmetrical triangle during the consolidation phase.

  • Flag Pattern: Characterized by parallel trendlines that slope, forming a rectangular shape during consolidation.

Conclusion

Pennant patterns are valuable tools in technical analysis, aiding traders in identifying potential continuations of prevailing trends after a brief consolidation. By recognizing the formation and understanding the characteristics of pennant patterns, traders can make informed decisions to capitalize on subsequent price movements.

Do you have a trading account app or demat account app?

You can open an account with Bajaj Broking in minutes.

Download the Bajaj Broking app now from Play Store or App Store.

Disclaimer: Investments in the securities market are subject to market risk, read all related documents carefully before investing.

This content is for educational purposes only. Securities quoted are exemplary and not recommendatory.

For All Disclaimers Click Here: https://www.bajajbroking.in/disclaimer

Share this article: 

Frequently Asked Questions

No result found

search icon

Read More Blogs

Disclaimer :

The information on this website is provided on "AS IS" basis. Bajaj Broking (BFSL) does not warrant the accuracy of the information given herein, either expressly or impliedly, for any particular purpose and expressly disclaims any warranties of merchantability or suitability for any particular purpose. While BFSL strives to ensure accuracy, it does not guarantee the completeness, reliability, or timeliness of the information. Users are advised to independently verify details and stay updated with any changes.

The information provided on this website is for general informational purposes only and is subject to change without prior notice. BFSL shall not be responsible for any consequences arising from reliance on the information provided herein and shall not be held responsible for all or any actions that may subsequently result in any loss, damage and or liability. Interest rates, fees, and charges etc., are revised from time to time, for the latest details please refer to our Pricing page.

Neither the information, nor any opinion contained in this website constitutes a solicitation or offer by BFSL or its affiliates to buy or sell any securities, futures, options or other financial instruments or provide any investment advice or service.

BFSL is acting as distributor for non-broking products/ services such as IPO, Mutual Fund, Insurance, PMS, and NPS. These are not Exchange Traded Products. For more details on risk factors, terms and conditions please read the sales brochure carefully before investing.

Investments in the securities market are subject to market risk, read all related documents carefully before investing. This content is for educational purposes only. Securities quoted are exemplary and not recommendatory.

[ Read More ]

For more disclaimer, check here : https://www.bajajbroking.in/disclaimer

Our Secure Trading Platforms

Level up your stock market experience: Download the Bajaj Broking App for effortless investing and trading

Bajaj Broking App Download

10 lakh+ Users

icon-with-text

4.4 App Rating

icon-with-text

4 Languages

icon-with-text

₹5100+ Cr MTF Book

icon-with-text
banner-icon

Open Your Free Demat Account

Enjoy low brokerage on delivery trades

+91

|

Please Enter Mobile Number

Open Your Free Demat Account

Enjoy low brokerage on delivery trades

+91

|