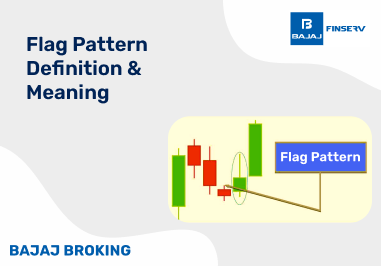
What is Flag Chart Pattern
A flag chart pattern forms when price moves sharply and then shifts into a narrow, contained consolidation. The first move establishes dominance. The consolidation tests whether that dominance still holds. This test happens within parallel boundaries that slope slightly against the main trend.
What matters for you is not the shape alone, but the context. The flagpole shows urgency. The flag shows hesitation, not rejection. This distinction is critical. If price were rejecting the move, structure would break. Instead, it compresses. That compression is what creates opportunity once participation returns and the structure resolves.
Additional Read: What Is a Candlestick Pattern?
How Does Flag Pattern Work
Flag patterns work because markets move in phases, not straight lines. After a sharp move, short-term participants step out. Long-term participants stay in. This creates temporary balance without destroying trend structure.
For you, this balance is visible on the chart. Range narrows. Volatility drops. Volume slows. None of this signals weakness. It signals digestion.
When fresh participation enters, price no longer needs to search for balance. It resumes direction. Understanding this process helps you avoid emotional exits during consolidation and prevents premature counter-trend decisions.
Types of Flags Chart Patterns
Before looking at individual flag types, you need to understand one thing. Flag variations do not change the logic of the pattern. They only change how consolidation expresses itself under different market conditions. Each type reflects a slightly different behaviour of participants during the pause.
Bull flag pattern
A bull flag forms after strong upward momentum. Price consolidates slightly downward or sideways. This shows profit booking without structural damage. For you, this tells one clear story. Demand remains dominant, and hesitation is temporary, not corrective.
Bear flag pattern
A bear flag appears after sharp downward momentum. Price drifts upward or sideways during consolidation. This reflects short-term covering, not demand reversal. You should read this as pressure building beneath the surface rather than recovery.
Ascending flag pattern
An ascending flag slopes upward during consolidation. This shows aggressive participation even during pauses. For you, this often indicates urgency. Breakouts from these structures tend to be faster because hesitation remains limited.
Descending flag pattern
A descending flag slopes downward during consolidation. This reflects caution rather than weakness. Participants hesitate before re-entering. When structure resolves, movement often accelerates as uncertainty clears.
How to Identify Flag Patterns
Before identification, you need discipline. Flags form quickly and fail quickly when misread. A structured checklist keeps you grounded in observation rather than assumption.
Confirm strong initial momentum: Without a clear directional move, there is no flag. You should always start by validating momentum strength. Weak moves do not produce reliable continuation structures.
Assess consolidation quality: Price should respect parallel boundaries. Tight, orderly consolidation matters more than perfect angles. For you, clean structure indicates controlled behaviour.
Evaluate volume behaviour: Volume typically contracts during consolidation. This shows reduced urgency, not rejection. Expansion near breakout confirms renewed participation.
Wait for structural resolution: A flag exists only after breakout. Anticipation introduces bias. Confirmation preserves discipline. You should always let structure complete before acting.
Additional Read: Morning Star Candlestick Pattern
Trading the Flag Chart Patterns
Trading flag patterns is not about speed. It is about timing participation. The pattern offers clarity on where risk concentrates and where uncertainty fades. This clarity allows you to plan rather than react.
For you, the real advantage lies in structure. Flags define invalidation clearly. They also define continuation zones cleanly. This reduces emotional decision-making during volatile sessions and helps you stay aligned with dominant market behaviour instead of short-term noise.
Strategies for Trading Flag Patterns
Before applying any strategy, align it with your temperament. Flags reward patience more than aggression. These approaches help you stay systematic rather than impulsive.
Breakout confirmation strategy: You enter only after the structure resolves. This reduces false signals and aligns you with momentum rather than prediction.
Post-breakout pullback strategy: Some breakouts retest structure. You use that retest for controlled entries. This suits you if you prioritise confirmation over speed.
Volume-aligned continuation strategy: You validate breakouts using participation strength. When volume supports structure, conviction improves and hesitation reduces.
Multi-timeframe alignment strategy: Higher timeframes define structure. Lower timeframes refine execution. This alignment filters noise and improves decision confidence.