


Open Your Free Demat Account
Enjoy low brokerage on delivery trades
 February 03, 2026
 7 mins read
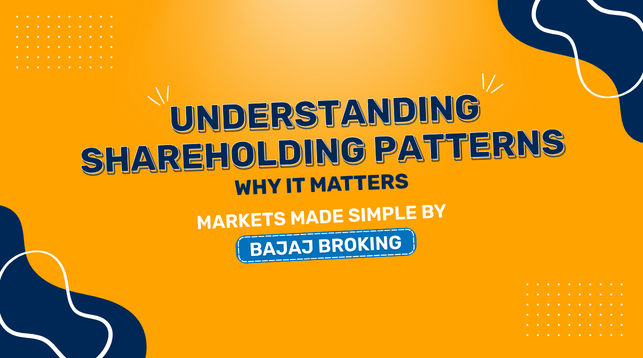
A shareholding pattern shows who owns a company and how ownership changes over time. It includes promoters, institutions, and retail investors. Tracking these changes helps readers understand shifts in ownership behaviour. When seen with other public data, it adds context to a company’s overall structure.
A shareholding pattern shows how a company’s shares are divided among investors. In simple terms, it tells who owns the company and how much they own. This information is not optional. In India, SEBI requires all listed companies to share this data every quarter.
Ownership is mainly split into two groups. These are promoters and public shareholders. Promoters include founders and related entities. Public shareholders include institutions and individual investors. Together, this data explains ownership structure, control, and transparency in a company.
People exploring the stock market often hear the term “shareholding pattern.” It simply means who owns a company and in what proportion. Ownership is usually shared. It is rarely held by one group alone.
Promoters form the first group. They start the company and guide its operations. The second group includes institutional investors such as mutual funds and insurance companies. Foreign institutions also invest in Indian companies. Retail investors form another group. Together, these investors make up the company’s ownership pattern.
A shareholding pattern shows how ownership is divided between promoters and public investors. Promoter holding includes shares owned by founders and related parties. Higher promoter holding sometimes means fewer shares were sold. In other cases, it reflects lower participation from public investors.
Public shareholding includes institutions and individual investors. This group covers domestic institutions, foreign institutions, and retail investors. Listed companies in India must publish this data every quarter. Over time, these updates help readers follow changes in ownership and participation.
Companies usually have more than one type of shareholder. Each type has different rights. The structure looks simple, but the differences matter.
Common shareholders: These shareholders hold equity shares. They usually have voting rights. Dividends may be paid, but they are not guaranteed. Most shares traded in the market are common shares.
Preferred shareholders: These shareholders do not have voting rights. However, they receive dividends before common shareholders. This happens only if dividends are declared.
Convertible preferred shareholders: These shareholders hold preference shares with a conversion option. At a fixed time, these shares may convert into equity shares.
A company’s ownership is divided into two main groups. These are promoters and public shareholders.
Promoters: This group includes the founders of the company. It also includes relatives and related entities holding shares.
Public shareholders: This group includes all non-promoter investors. It consists of the following:
Retail investors: These are individual investors. Their holdings are usually small. Regulations protect their interests.
Domestic institutional investors: These institutions operate mainly in India. Examples include mutual funds, banks, and insurance companies.
Foreign institutional investors (FIIs): These are institutions based outside India. They invest in Indian listed companies.
Analysing a shareholding pattern means watching ownership changes over time. The process becomes easier when broken into steps.
Track quarterly changes: Companies release shareholding data every quarter. Comparing old and new data shows ownership movement.
Check promoter holding: Promoter holding shows how much stake founders still own. Changes help explain the ownership structure.
Observe institutional presence: Institutions include mutual funds and foreign investors. Their presence shows how ownership is spread.
Review ownership spread: A wider spread shows how control is shared among investor groups.
Calculating a shareholding pattern follows a simple process. All required data is public.
Step 1: Find total shares
Check the total number of issued shares. This is available in exchange filings.
Step 2: Identify shareholder groups
Separate promoters and public shareholders.
Step 3: Calculate percentages
Divide each group’s shares by the total shares. Multiply by 100.
Step 4: Compare quarterly data
Review past data to see how ownership changes over time.
Studying shareholding patterns helps explain ownership behaviour. These changes often reflect internal developments.
Shows ownership direction: Changes in promoter holding explain how ownership is arranged.
Highlights promoter movement: Large changes in promoter stake stand out clearly. These require careful reading of disclosures.
Tracks institutional movement: Institutional holdings often change across companies. This shows broader positioning.
Adds context to review: Single changes may not say much. Patterns across peers provide better clarity.
Finding a company’s shareholding pattern is simple. The data is public and updated regularly.
Stock exchange websites: Companies submit quarterly data to BSE and NSE.
Company websites: Many companies publish ownership data under investor relations.
Financial platforms: Market platforms display shareholding data in clear formats.
Annual reports: Annual reports show ownership details over longer periods.
Share this article: 
Disclaimer :
Investments in the securities market are subject to market risk, read all related documents carefully before investing. This content is for educational purposes only. Securities quoted are exemplary and not recommendatory.
The information on this website is provided on "AS IS" basis. Bajaj Broking (BFSL) does not warrant the accuracy of the information given herein, either expressly or impliedly, for any particular purpose and expressly disclaims any warranties of merchantability or suitability for any particular purpose. While BFSL strives to ensure accuracy, it does not guarantee the completeness, reliability, or timeliness of the information. Users are advised to independently verify details and stay updated with any changes. The securities are quoted as an example and not as a recommendation. Past performance is not necessarily a guide to future performance.
The information provided on this website is for general informational purposes only and is subject to change without prior notice. BFSL shall not be responsible for any consequences arising from reliance on the information provided herein and shall not be held responsible for all or any actions that may subsequently result in any loss, damage and or liability. Interest rates, fees, and charges etc., are revised from time to time, for the latest details please refer to our Pricing page.
Neither the information, nor any opinion contained in this website constitutes a solicitation or offer by BFSL or its affiliates to buy or sell any securities, futures, options or other financial instruments or provide any investment advice or service.
BFSL is acting as distributor for non-broking products/ services such as IPO, Mutual Fund, Insurance, PMS, and NPS. These are not Exchange Traded Products. For more details on risk factors, terms and conditions please read the sales brochure carefully before investing.
Content Partner - Dalal Street Investment Journal Wealth Advisory Private Limited
This article is for educational purposes only and should not be considered investment advice. Market investments are subject to risks. DSIJ Wealth Advisory Private Limited is a SEBI-registered Research Analyst (Reg. No: INH000006396) and Investment Adviser (Reg. No: INA000001142). Please consult your financial adviser before investing.
For more disclaimer, check here : https://www.bajajbroking.in/disclaimer
Level up your stock market experience: Download the Bajaj Broking App for effortless investing and trading

Open Your Free Demat Account
Enjoy low brokerage on delivery trades
|
Please Enter Mobile Number
Open Your Free Demat Account
Enjoy low brokerage on delivery trades
|


