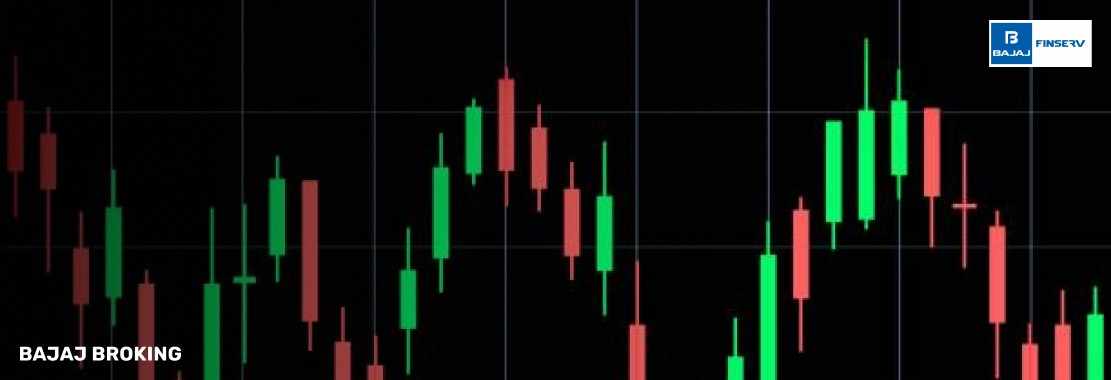
Reading charts and maps are basics of stock trading. These charts can be quite complex at times. However, with the help of certain tools, it becomes easier to read the charts and maps and make decisions. Traders can utilize these tools to align their trading goals and make informed moves accordingly.
One of the common tools used for understanding the movement of securities is candlestick patterns. It is a pattern that resembles the shape of a candle with side wicks. Increasing and decreasing prices over a specific time frame can be understood using the candlestick patterns.
Shooting stars and inverted hammers are two common types of candlestick patterns. In this guide, we will discuss what these patterns are and the differences between shooting stars and inverted hammers.
What is a Shooting Star Candlestick Pattern?
A shooting star is a bearish reversal candlestick that generally occurs at the end of an uptrend, indicating the upward momentum might be dissipating. It has a small real body near the day's low, a long upper shadow at least twice the body size, and minimal or no lower shadow.
The pattern occurs when the prices open well above, rally throughout the session, but then fall back, closing close to the opening price, indicating that the sellers displaced the buyers by the end of the session. In day-trading, a shooting star generally follows a run of green (up) candles, typically a minimum of three, and indicates that the last buyers are entering just as early sellers start profit-taking.
Traders typically wait for confirmation in the next candle before they act. Better yet, the next session opens lower, perhaps through a gap and closes below the body of the shooting star, confirming the reversal. In the absence of confirmation or a rally above the high of the shooting star, the signal can be false and more likely represent a resistance level than a trend reversal.
Though easy to recognise, the shooting star must be used with caution and preferably in combination with volume analysis, resistance areas, or other technical indicators to augment its predictive power.
What is an Inverted Hammer Candlestick Pattern?
The inverted hammer is a bullish reversal candlestick pattern that appears at the termination of a downtrend, indicating a potential shift from selling to buying pressure. It looks visually like an inverted hammer: there is a tiny actual body at the lower end, a big upper shadow of at least twice the body's size, and little or no lower shadow, indicating prices opened low, rallied throughout the session, but retreated, though closing close to the opening after the buyers attempted to carry the momentum further.
The formation signals the buyers entering the midst of decline. The tall upper wick indicates their effort to drive prices higher, although they weren't able to maintain it throughout the day. Still, the inverted hammer is just a potential sign; traders usually need confirmation, such as a powerful bullish candle or technical indicators above, to believe in the reversal.
It is less frequent than the normal hammer and should be interpreted with caution, not to misread. Ideally, it appears near support zones or after prolonged declines, where the probability of a rebound is higher. When confirmed, it provides a strategic entry point for buyers seeking to capitalise on an emerging upward trend.
Key Differences Between Shooting Star and Inverted Hammer
Some of the highlighting differences between the shooting star and the inverted hammer are:
Feature
| Shooting Star
| Inverted Hammer
|
Type of Signal
| Bearish reversal
| Bullish reversal
|
Market Trend
| Appears at the end of an uptrend
| Appears at the end of a downtrend
|
Shape and Structure
| Small real body at the bottom, long upper wick
| Small real body at the bottom, long upper wick
|
Lower Shadow
| Little to none
| Little to none
|
Indicates
| Selling pressure may increase, trend may reverse
| Buying pressure may emerge, trend may reverse
|
Trader Action
| Often a signal to consider selling or shorting
| Often a signal to consider buying or covering
|
Confirmation Needed
| Yes, typically a lower close on the next candle
| Yes, typically a higher close on the next candle
|
Risk of False Signal
| High without confirmation
| High without confirmation
|
Best Used With
| Resistance levels, volume analysis, RSI
| Support levels, volume confirmation, RSI
|
Psychological Meaning
| Buyers tried to push price higher but failed
| Sellers pushed price down but buyers resisted
|
Although they appear visually similar, the shooting star and inverted hammer convey distinctly different market sentiments based on their position in the trend. Confirmation from subsequent candles and the use of supporting indicators is essential for both patterns to reduce the risk of false signals and make more informed trading decisions.
Trading Strategies Using Shooting Star and Inverted Hammer
Wait for Confirmation Before Acting
Never trade solely based on the formation of a shooting star or inverted hammer. Wait for the next candle to confirm the trend reversal—bearish in case of a shooting star and bullish in case of an inverted hammer.
Use with Key Support and Resistance Levels
These patterns become more reliable when they appear near significant support zones (for inverted hammer) or resistance zones (for shooting star). These levels help validate the possibility of a potential reversal.
Combine with Volume Analysis
A higher trading volume during the formation of either pattern enhances its strength. In the case of a shooting star, high volume suggests strong seller interest. For an inverted hammer, high volume signals strong buyer interest.
For a shooting star, place a stop-loss just above the wick of the candle. For an inverted hammer, set the stop-loss just below the wick. This protects against false breakouts.
Use Trendlines and Moving Averages
If the shooting star appears above a declining trendline or the 50-day moving average, it strengthens the bearish outlook. An inverted hammer near a rising trendline or moving average boosts the bullish case.
Enter a short position on a confirmed bearish candle after a shooting star. Enter a long position after a confirmed bullish candle following an inverted hammer.
Maintain a risk-reward ratio of at least 1:2 to ensure favourable trade setups.
Avoid Trading in Sideways Markets
These patterns are less reliable in choppy, non-trending markets. They work well in clearly defined uptrends (shooting star) and downtrends (inverted hammer).
RSI or MACD can help confirm momentum weakening (for a shooting star) or strengthening (for an inverted hammer).
Conclusion
The shooting star and inverted hammer are powerful candlestick patterns that help traders identify potential trend reversals. While they look similar, their meaning depends on their position in the market trend. A shooting star suggests a bearish reversal at the top of an uptrend, while an inverted hammer indicates a possible bullish reversal at the end of a downtrend.
Used in conjunction with confirmation signals, support and resistance levels, and volume analysis, these patterns can enhance trading accuracy and improve decision-making in dynamic market conditions.
Disclaimer: This article is for informational purposes only and does not constitute investment advice.


